95-2052 Waikalani Pl Unit B404 · Waipio Acres, HI
Flood risk 1/10 · Minimal
- FEMA flood zone
- D
- Chance of flooding over 30 yrs
- 0.0%
- Est. flood insurance / yr
- $544 – $1,084
Fire risk No data
- Est. fire insurance / yr
- —
Heat risk No data
- Hot days now (above threshold)
- —
- Hot days in 30 yrs
- —
Wind risk No data
- Chance of severe wind over 30 yrs
- —
Air-quality risk 1/10 · Minimal
- Unhealthy air days now
- —
- Unhealthy air days in 30 yrs
- —
Risk factors via First Street. Map © Google.
Why this score? — see what drove the D grade
The composite is a weighted blend of 9 inputs, each scored 0–100. Each bar is that input's sub-score; the figure is the points it added to the 100-point composite (weight × sub-score).
- ARV discount +14.6/15.0
- Cash flow +6.4/30.0
- Appreciation +5.7/10.0
- Rent growth +3.9/5.0
- Schools +3.7/10.0
- Livability +3.7/5.0
- Condition / age +2.5/5.0
- 1% rule +2.0/10.0
- DSCR +0.7/10.0
$355,000
🖨 Deal sheet (PDF) 📄 Offer letter ✓ Due diligence
Listing remarks
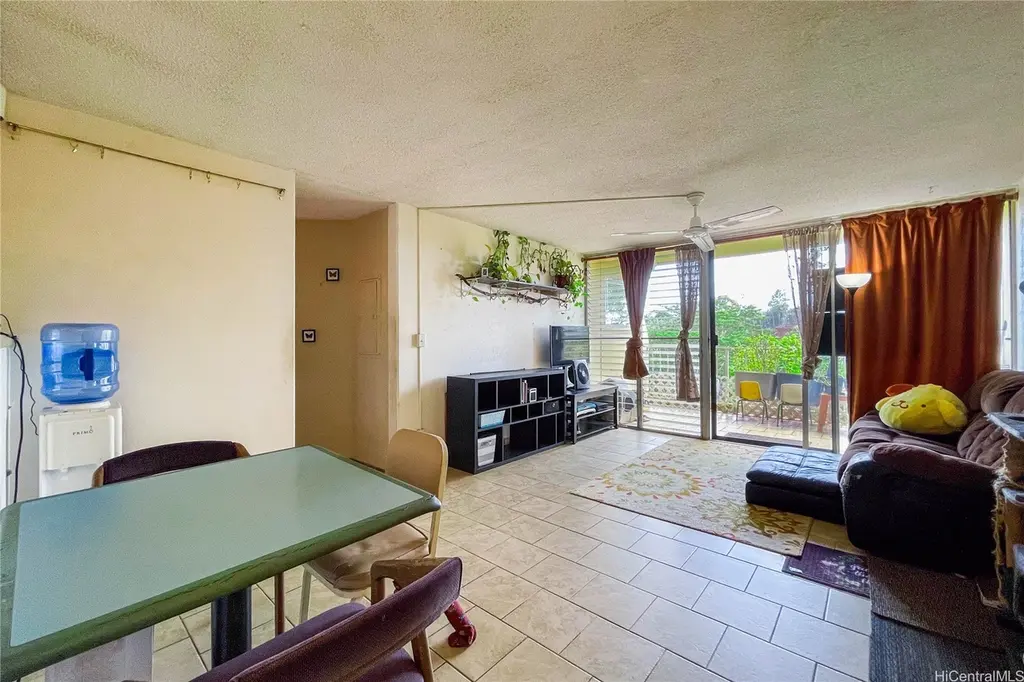
LOWEST MAINTENANCE FEES IN MILILANI! Bring your vision to this top-floor gem in the heart of Mililani! While this unit is ready for a cosmetic refresh, it offers a solid foundation and a ton of potential for a buyer looking to build sweat equity. Featuring durable, easy-care tiled flooring throughout and a recently updated water heater, the essentials are in place for your creative touch. Nestled in a lush, tropical setting with fantastic community amenities, you are just minutes from Mililani Town Center’s shopping and dining. For showings, guest parking is conveniently located outside in front of the parking garage. Perfectly positioned for outdoor enthusiasts with quick access
Key facts
- Top-floor gem
- $479 HOA
- 2 parking spots
Tags
Property features AI
Finance
- Other: Community amenities managed by association
- HOA & community: Monthly maintenance fee around $479.99; Association covers common areas, grounds maintenance, structure maintenance, sewer and water; Association provides management
Exterior
- Parking: Assigned covered parking (1 space); Open parking available; Total 2 parking spaces
- Security: Key card entry; Security guard
- Utilities: Water included in association; Sewer included in association; Power available
- Home design: Condominium in Ridgecrest-Melemanu; Entry on level 4; Fee simple; Low-density apartment zoning
- Construction: Concrete construction; Built in 2004
- Exterior features: Key card entry; Security guard; Clubhouse; Community pool; Dog park; Trash chute
Interior
- Flooring: Ceramic tile
- Bathrooms: 1 full bathroom
- Interior features: Ceramic tile flooring; Average condition; Has a view
Neighborhood map
What this means for you Summary
Snapshot
- This is a 2-bed/1.0-bath condo listed at $355k.
Deal economics
- At list price, monthly cash flow is $-616 ($-7k/yr) — negative.
- To cash-flow at today's rent, offer at most $246k (30.7% below list).
- To meet the 1% rule (rent ≥ 1% of price), the offer needs to be $250k (29.6% below list).
- Recommended offer: $246k (30.7% below list) — sets the bar for cash-flow.
Location & tenants
- Location reads 74/100 on livability (#14 in HI, #4,795 nationally) — a middle-class / working-renter tenant base. Strengths: commute A+, employment A+, health & safety A+; Watch: amenities F, cost of living F.
- Hawaii Department Of Education (suburban): math 32% / reading 50% proficiency, ranked #1 of 1 in HI (top 100%) — families likely to look elsewhere, expect single-tenant / working-renter base with shorter leases.
- Zoned schools: Kipapa Elementary School (math 39% / reading 52%, grade D-, #70 of 183 statewide, top 39%, 518 students, 47% FRL); Mililani Middle School (math 40% / reading 67%, grade C+, #4 of 42 statewide, top 7%, 1,580 students, 20% FRL); Mililani High School (math 42% / reading 73%, grade C, #2 of 43 statewide, top 2%, 2,565 students, 18% FRL).
- Market conditions: Rents rising fast (+5.5%/yr); 134 active listings in the ZIP; 22 comparable units currently listed for rent nearby; rentals at typical pace (median 19d on market — plan ~3-4 weeks tenant-placement turnaround); high-income renter base; 1,638 units permitted in Honolulu County in 2024 (793 in 5+ unit buildings).
Forward outlook
- In year one you build about $8k of equity ($2k loan paydown + $5k appreciation (1.5% local appreciation)).
- Honolulu County population projected at +17% by 2050 — long-run rental-demand tailwind backs the buy-and-hold thesis.
- By year 5, paydown + projected appreciation supports a ~$35k cash-out refi (75% LTV) — recoverable capital for the next deal without selling this one.
Negotiation context
- It's been on market 31 days — a 3% lower offer ($344k) is reasonable based on typical stale-listing flexibility.
- 7 sale attempts since 20y ago with the ask held roughly flat each time — persistent listings suggest the price (not the market) is what's stuck; bring a comps-based counter.
- Current owner paid $230k; list at $355k implies a 54% gain — meaningful room to come down on a strong offer.
Questions for the listing agent
- What do current leases actually rent for vs. the listed asking? Can we see a recent rent roll and the last 12 months of T-12 income?
- It's been on market 31 days. Have you received any prior offers? Is the seller open to a 31% concession, seller financing, or rate buy-down credit?
- Built in 1973 — when were the roof, HVAC, electrical panel, plumbing, and water heater last replaced?
- What does the HOA fee cover, when was the last increase, and are there any pending special assessments or reserve-fund shortfalls?
- Any open or pending special assessments — roof, HVAC, plumbing, elevator, façade? What's the per-unit balance and payoff schedule, and is the seller paying it off at close or rolling it to the buyer?
- Is there a deadline driving the sale (1031 exchange, divorce, estate, relocation)? That informs how much negotiation room exists.
- The area grade is low — what's the realistic commute time and amenity access for the typical tenant pool here? Any planned neighborhood developments (good or bad) we should know about?
- What's the average days-on-market for RENTAL listings here right now (not sales)? A rising rental-DOM trend means longer vacancies and softer asking-rent achievability than the comps imply.
- What's the recent tenant-quality profile in this submarket — average credit score on applications, eviction rate, late-payment / NSF rate, and stable-employment percentage? A property-management company in the area should have these aggregated.
- How much new apartment / multifamily construction is in the pipeline within 1–3 miles? Heavy new supply (>2% of stock underway) typically softens rents 12–24 months out; light construction supports rent growth.
Investment metrics
- 1% rule
- 0.70% ✗
- Cap rate
- 4.21%
- Cash-on-cash
- -7.44%
- DSCR
- 0.67
- GRM
- 11.8
CMA / ARV
- ARV (median comp)
- $421,387
- List price
- $355,000
- Delta
- -11.01%
- Verdict
- UNDERPRICED
- Comps
- 5 within 1.0 mi
Projected returns pro-forma
1.48% appreciation · 5.55% rent growth · sell at horizon
- IRR
- -3.3%
- Equity multiple
- 0.82×
- Total profit
- $-17,412
- Equity at exit
- $130,223
- IRR
- 3.0%
- Equity multiple
- 1.41×
- Total profit
- $40,576
- Equity at exit
- $180,268
Cash invested: $99,400 (down + closing). Projections, not guarantees.
Landlord ↔ Tenant lean methodology
- Overall (STATE)
- 37 Tenant-Leaning
- State Hawaii
- 37 Tenant-Leaning · D+13
- County
- — inherits STATE
- City
- — inherits STATE
ZIP-level market 96789
- Home prices YoY
- 0.3%
- Rents YoY
- 5.5%
- Active inventory
- 134
- Price-to-rent
- 11.8×
Monthly cashflow live
- Estimated rent
- $2,500 high interval (Pro) →
- Mortgage (P&I)
- −$1,862
- Tax from tax record
- −$102 /mo · $1,227/yr
- Insurance
- −$148
- HOA
- −$479
- Vacancy / Maint / Mgmt
- −$525
- Net cashflow
- $-616
Break-even live
Sensitivity live
| Price | -10% $-415 | -5% $-516 | +0% $-616 | +5% $-717 | +10% $-817 |
|---|---|---|---|---|---|
| Rent | -10% $-814 | -5% $-715 | +0% $-616 | +5% $-517 | +10% $-419 |
| Rate | -1.0pp $-437 | -0.5pp $-526 | base $-616 | +0.5pp $-708 | +1.0pp $-802 |
UW: 25.0% down · 7.5% · 30yr · 1.5% tax · 5.0% vac · 8.0% maint · 8.0% mgmt
Financing live
Cash to close
- Down payment
- $88,750
- Closing costs
- $10,650
- Reserves months
- —
- Total cash needed
- —
Loan-product check · same deal, 3 products live
Conventional
25% down · 7.5% · 30yr
- Down + closing
- —
- Monthly P&I
- —
- Monthly cashflow
- —
- DSCR
- —
- Eligible?
- —
Personal DTI + credit; lowest rate.
DSCR
20% down · 8.5% · 30yr
- Down + closing
- —
- Monthly P&I
- —
- Monthly cashflow
- —
- DSCR
- —
- Eligible?
- —
No personal income docs; deal must DSCR.
Hard money
10% down · 12.0% · 12mo
- Down + closing
- —
- Monthly P&I
- —
- Monthly cashflow
- —
- DSCR
- —
- Eligible?
- —
Short-term bridge; refi at stabilization.
Rent comps 22 comps
| Address | Beds | Baths | Sqft | Rent | $/sqft | DOM | Units | Dist |
|---|---|---|---|---|---|---|---|---|
| 95-2052 Waikalani Pl Unit B106 Mililani, HI | 2.0 | 1.0 | 799 | $2,250 | $2.82 | 5d | 1 | 0.02mi |
| 95-2048 Waikalani Pl Unit D106 Mililani, HI | 2.0 | 1.0 | 799 | $2,350 | $2.94 | 23d | 1 | 0.02mi |
| 95-2052 Waikalani Pl Unit B107 Mililani, HI | 2.0 | 1.0 | 799 | $2,450 | $3.07 | 5d | 1 | 0.02mi |
| 95-009 Waikalani Dr Unit A104 Mililani, HI | 2.0 | 1.0 | 855 | $2,500 | $2.92 | 23d | 1 | 0.14mi |
| 95-2047 Waikalani Pl Unit D104 Mililani, HI | 1.0 | 1.0 | 607 | $2,100 | $3.46 | 19d | 1 | 0.16mi |
| 95-099 Waikalani Dr Unit A104 Mililani, HI | 2.0 | 1.0 | 850 | $2,500 | $2.94 | 23d | 1 | 0.24mi |
| 95-024 Waihau St Unit 11A Mililani, HI | 2.0 | 1.0 | 682 | $2,245 | $3.29 | 45d | 1 | 0.26mi |
| 95-142 Wailawa Pl Unit B Mililani, HI | 3.0 | 2.0 | 900 | $2,700 | $3.00 | 5d | 1 | 0.46mi |
| 95-149 Wailawa Pl Unit B Mililani, HI | 3.0 | 2.0 | 900 | $2,700 | $3.00 | 5d | 1 | 0.51mi |
| 95-257 Waikalani Dr Unit B503 Mililani, HI | 2.0 | 1.0 | 793 | $2,550 | $3.22 | 18d | 1 | 0.61mi |
| 95-273 Waikalani Dr Mililani, HI | 3.0 | 2.0 | 1023 | $3,600 | $3.52 | 12d | 1 | 0.69mi |
| 95-269 Waikalani Dr Unit C906 Mililani, HI | 3.0 | 2.0 | 1023 | $3,000 | $2.93 | 19d | 1 | 0.70mi |
| 95-510 Wikao St Mililani, HI | 2.0–3.0 | 1.0–2.0 | 895 | $2,245 | $2.51 | 45d | 2 | 0.93mi |
| 95-976 Ukuwai St #903 Mililani, HI | 3.0 | 2.0 | 923 | $3,250 | $3.52 | 45d | 1 | 1.17mi |
| 95-648 Hanile St Unit C107 Mililani, HI | 2.0 | 1.0 | 723 | $2,600 | $3.60 | 25d | 1 | 1.24mi |
| 95-664 Wikao St Unit L201 Mililani, HI | 2.0 | 2.0 | 797 | $2,800 | $3.51 | 5d | 1 | 1.26mi |
| 95-664 Wikao St Unit L206 Mililani, HI | 2.0 | 2.0 | 797 | $2,700 | $3.39 | 45d | 1 | 1.26mi |
| 95-1050 Makaikai St Mililani, HI | 1.0 | 1.0 | 529 | $2,000 | $3.78 | 45d | 1 | 1.27mi |
| 95-919 Wikao St Unit F303 Mililani, HI | 2.0 | 1.0 | 713 | $2,600 | $3.65 | 25d | 1 | 1.39mi |
| 95-797 Wikao St Unit B102 Mililani, HI | 2.0 | 2.0 | 1056 | $2,700 | $2.56 | 4d | 1 | 1.39mi |
| 95-1145 Koolani Dr #101 Mililani, HI | 2.0 | 2.0 | 806 | $2,500 | $3.10 | 18d | 1 | 1.39mi |
| 95-930 Wikao St Unit B102 Mililani, HI | 2.0 | 2.0 | 1056 | $2,700 | $2.56 | 4d | 1 | 1.49mi |
HOA detail condo
- Monthly dues
- $479 · $5,748/yr
- Likely covers
- water
- Assessments
- None detected in remarks — confirm with the listing agent.
Listing history 37 events
-
2026-06-21days on market $355,000 Active 31 DOM
-
2026-06-18days on market $355,000 Active 28 DOM
-
2026-06-17days on market $355,000 Active 27 DOM
-
2026-06-16days on market $355,000 Active 26 DOM
-
2026-06-15days on market $355,000 Active 25 DOM
-
2026-06-13days on market $355,000 Active 23 DOM
-
2026-06-13days on market $355,000 Active 22 DOM
-
2026-06-10days on market $355,000 Active 20 DOM
-
2026-06-09days on market $355,000 Active 19 DOM
-
2026-06-08days on market $355,000 Active 18 DOM
-
2026-06-07days on market $355,000 Active 17 DOM
-
2026-06-05days on market $355,000 Active 14 DOM
-
2026-06-03days on market $355,000 Active 13 DOM
-
2026-06-02days on market $355,000 Active 12 DOM
-
2026-06-01days on market $355,000 Active 11 DOM
-
2026-05-31days on market $355,000 Active 10 DOM
-
2026-04-21$375,000 Active 984-char remark
-
2026-04-20historical
-
2026-04-09price $389,000
-
2026-03-24price $395,000
-
2026-03-03$410,000 Active
-
2016-08-18soldstatus $230,000 Sold
-
2016-08-18soldstatus $230,000
-
2016-08-17status Pending
-
2016-07-02$230,000 Active
-
2008-08-11historical
-
2008-08-01$229,000
-
2007-09-14historical
-
2007-07-19$249,999
-
2006-10-06historical
-
2006-07-26$275,000
-
2005-07-13soldstatus $175,000
-
1995-12-20soldstatus $94,000
-
1983-05-01soldstatus $68,000
-
1980-04-01soldstatus $62,500
-
1980-03-01soldstatus $62,500
-
1979-02-01soldstatus $36,750
ⓘ Source: listings_history table (triggers on properties + properties_extension) + one-shot
backfill from property_details.listing_events for pre-trigger history.
Tax reassessment forecast HI · Partial reset (capped growth)
- Current annual tax
- $1,227 · $102/mo
- Projected year-2 tax
- $1,227 · $102/mo
- Expected delta
- $0/yr ($0/mo · 0.0%)
ⓘ Screening estimate from a state-policy table — verify with the county assessor before closing.
Climate risk First Street
- Flood 1/10 Low FEMA zone D · 0% chance over 30 yrs
- Air quality 1/10 Low
Nearby sold comps map
Loading sold comps map…
Walkable amenities ~0.75 mi
Loading nearby amenities…
Taxation est. · year 1
- Rental income
- $29,996
- − Mortgage interest
- −$19,886
- − Property taxes
- −$1,227
- − Insurance
- −$1,775
- − Repairs & maintenance
- −$2,400
- − Management
- −$2,400
- − HOA
- −$5,748
- − Depreciation
- −$10,327
- Taxable loss
- −$13,766
- Est. tax savings @ 24.0%
- +$3,304
- After-tax cash flow
- $-4,089/yr
For passive investors: Depreciation is non-cash, so a rental often shows a tax loss while cash-flowing — sheltering income. Rental losses are passive: they offset passive income freely, and up to $25,000/yr can offset ordinary (W-2) income if you actively participate and your MAGI is under $100k (phasing out to $0 by $150k); unused losses carry forward. On sale, claimed depreciation is recaptured at up to 25%, and gains may owe capital-gains tax (a 1031 exchange can defer both). Figures are a year-1 estimate at your 24.0% rate — not tax advice; consult a CPA.
Schools (NCES district)
- District
- Hawaii Department Of Education
- NCES district ID
- 1500030
- Math proficiency
- 32% ▼ -10.00%
- Reading proficiency
- 50% ▼ -3.00%
- Median HH income
- $69,005
- Composite
- 37.07/100
- National rank
- #4504
- State rank
- #1 of 1 in HI
Livability — Waipio Acres
- Score
- 74/100
- State rank
- #14
- US rank
- #4795
Category grades
Schools grade is shown separately in the Schools card above.
Census & demographics
- Census place
- Waipio Acres, HI
- County
- Honolulu County · 963,448 people
- Metro
- Urban Honolulu, HI
- Population (ZIP)
- 54,278
- Household income
- $127,066
- Rent vs Own
- Severe rent burden
- 920.0
Population outlook (Honolulu County) Hauer SSP2
- Today (2025)
- 1,072,641 people
- By 2030
- 1,110,460 · +3.5%
- By 2040
- 1,181,593 · +10.2%
- By 2050
- 1,257,584 · +17.2%
- By 2075
- 1,501,120 · +39.9%
- By 2100
- 1,764,430 · +64.5%
Race, ethnicity, and origin ACS 2023
- Neighborhood character
- Highly diverse neighborhood (Simpson 0.75)
- Race & ethnicity
- Asian 48% Two or more races 30% White 11% Hispanic / Latino 10% Pacific Islander 5% Black 2%
- Hispanic origin (detail)
- Mexican 3% Puerto Rican 3%
- Common ancestry
- Russian 3% Lithuanian 1% Romanian 1%
- Foreign-born
- 10% · South Korea, China, Canada
- Languages at home
- 87% English-only · Other Asian/Pacific 5% Tagalog/Filipino 3% Spanish 1%
Political lean MEDSL · Honolulu
- 2024 margin
- Strong D (+21.6) · D 59.9% · R 38.3% · Other 1.8%
- 2008→2024 swing
- -19.4pp toward R · 2008: 41.1pp · 2024: 21.6pp
- All cycles
- 2024: D+21.6 2020: D+26.9 2016: D+29.9 2012: D+39.1 2008: D+41.1
Not yet ingested
- Civics
- —
Market trends
- HPI YoY
- ▲ 1.48%
- Current HPI
- 436.0365
- Rent YoY
- ▲ 5.55%
- Metro
- Urban Honolulu, HI
- State GDP YoY
- —
- F500 in state
- 0
Price history
+866.0% since first listed23 events — show timeline
- 2026-05-21 Listed $355,000 HiCentral MLS
- 2026-05-19 Listing Removed — HiCentral MLS
- 2026-04-21 Listed $375,000 HiCentral MLS
- 2026-04-20 Listing Removed — HiCentral MLS
- 2026-04-09 Price Changed $389,000 HiCentral MLS
- 2026-03-24 Price Changed $395,000 HiCentral MLS
- 2026-03-03 Listed $410,000 HiCentral MLS
- 2016-08-18 Sold (Public Records) $230,000 Public Records
- 2016-08-18 Sold (MLS) $230,000 HiCentral MLS
- 2016-08-17 Pending — HiCentral MLS
- 2016-07-02 Listed $230,000 HiCentral MLS
- 2008-08-11 Listing Removed — HiCentral MLS
- 2008-08-01 Listed $229,000 HiCentral MLS
- 2007-09-14 Listing Removed — HiCentral MLS
- 2007-07-19 Listed $249,999 HiCentral MLS
- 2006-10-06 Listing Removed — HiCentral MLS
- 2006-07-26 Listed $275,000 HiCentral MLS
- 2005-07-13 Sold (Public Records) $175,000 Public Records
- 1995-12-20 Sold (Public Records) $94,000 Public Records
- 1983-05-01 Sold (Public Records) $68,000 Public Records
- 1980-04-01 Sold (Public Records) $62,500 Public Records
- 1980-03-01 Sold (Public Records) $62,500 Public Records
- 1979-02-01 Sold (Public Records) $36,750 Public Records
Property tax history
+9.8%/yrLatest (2022): $1,227 · +24.4% YoY. Source: county tax records.
Cash-flow waterfall
monthlySold comps — $/sqft
last 12 mo · ≤1 miLoading sold comps…