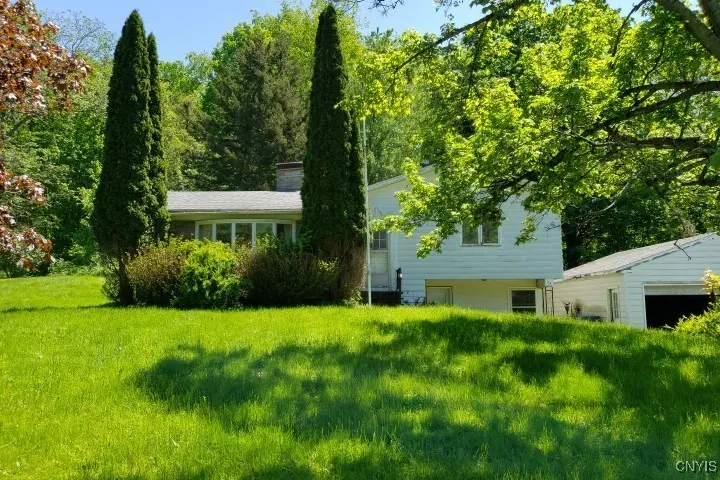
24 Loomis Ter
Phoenix, NY 13135
$199,900D
3 bd · 2.0 ba ·
1,726 sqft ·
Built 1965
· SingleFamily
· Active
· 367 DOM
Cashflow @ list (25.0% down · 7.5%)
Estimated rent
$1,364/mo
Mortgage (P&I)
−$1,048
Tax + insurance
−$581
HOA
−$0
Vac / Maint / Mgmt
−$286
Net cashflow
$-552/mo
Annual
$-6,627/yr
Cap rate
2.98%
Cash-on-cash
-11.84%
DSCR
0.47
1% rule
0.68%
Cash to close
$55,972
Investor read
- This is a 3-bed/2.0-bath single-family listed at $200k.
- At list price, monthly cash flow is $-552 ($-7k/yr) — negative.
- To cash-flow at today's rent, offer at most $119k (40.2% below list).
- To meet the 1% rule (rent ≥ 1% of price), the offer needs to be $136k (31.8% below list).
- It's been on market 367 days — a 12% lower offer ($176k) is reasonable based on typical stale-listing flexibility.
- Recommended offer: $119k (40.2% below list) — sets the bar for cash-flow.
- In year one you build about $21k of equity ($1k loan paydown + $20k appreciation (10.0% local appreciation)).
- Location reads 67/100 on livability (#613 in NY) — a middle-class / working-renter tenant base. Strengths: cost of living A+, housing A+, crime B+; Watch: employment C-, amenities F, commute F.
- Phoenix Central School District (suburban): math 45% / reading 51% proficiency, ranked #416 of 590 in NY (top 70%) — families likely to look elsewhere, expect single-tenant / working-renter base with shorter leases.
- Zoned schools: Michael A Maroun Elementary School (math 36% / reading 45%, grade F, #1,413 of 2,108 statewide, top 67%, 667 students, 58% FRL); Emerson J Dillon Middle School (math 35% / reading 40%, grade F, #445 of 729 statewide, top 61%, 514 students, 60% FRL); John C Birdlebough High School (math 87% / reading 87%, grade A, #311 of 1,100 statewide, top 30%, 473 students, 59% FRL) — zoned schools average 59% FRL vs 41% district-wide (18 pts higher); higher-poverty schools than district average — tighter screening recommended.
- Watch-outs: property tax is 3.0% of price.
- Market conditions: 40 active listings in the ZIP; 172 units permitted in Oswego County in 2024 (27 in 5+ unit buildings).
- Oswego County population projected at -23% by 2050 — secular population decline; favor cash flow + early exit over multi-decade hold.
- Current owner paid $117k; list at $200k implies a 71% gain — meaningful room to come down on a strong offer.
- By year 2, paydown + projected appreciation supports a ~$34k cash-out refi (75% LTV) — recoverable capital for the next deal without selling this one.
- Cap rate 3.0% vs local median 1.9% in Phoenix — top-decile yield for the area; either an underpriced asset or a hidden risk that comps aren't pricing in. Stress-test before assuming the spread holds.
Questions for listing agent
- What do current leases actually rent for vs. the listed asking? Can we see a recent rent roll and the last 12 months of T-12 income?
- It's been on market 367 days. Have you received any prior offers? Is the seller open to a 40% concession, seller financing, or rate buy-down credit?
- Built in 1965 — when were the roof, HVAC, electrical panel, plumbing, and water heater last replaced?
- Property tax is high relative to price — has the assessment been appealed recently, and will the sale trigger a re-assessment?
- Why hasn't it sold? Are there any deal-killer items the seller is aware of (foundation, flood, title, zoning, code violations)?
- Is there a deadline driving the sale (1031 exchange, divorce, estate, relocation)? That informs how much negotiation room exists.
- The area grade is low — what's the realistic commute time and amenity access for the typical tenant pool here? Any planned neighborhood developments (good or bad) we should know about?
- What's the average days-on-market for RENTAL listings here right now (not sales)? A rising rental-DOM trend means longer vacancies and softer asking-rent achievability than the comps imply.
CashFlowRE · CFR-J4V3Z86Z47925B
· Data 1 day ago
cashflowre.app · 2026-05-29