24 Loomis Ter · Phoenix, NY
Flood risk 1/10 · Minimal
- FEMA flood zone
- X (unshaded)
- Chance of flooding over 30 yrs
- 0.0%
- Est. flood insurance / yr
- $473 – $860
Fire risk 1/10 · Minimal
- Est. fire insurance / yr
- $691 – $1,283
Heat risk 2/10 · Minimal
- Hot days now (above 96°F)
- 7 days/yr
- Hot days in 30 yrs
- 16 days/yr
Wind risk 1/10 · Minimal
- Chance of severe wind over 30 yrs
- 0.0%
Air-quality risk 2/10 · Minimal
- Unhealthy air days now
- 1 days/yr
- Unhealthy air days in 30 yrs
- 1 days/yr
Risk factors via First Street. Map © Google.
Why this score? — see what drove the D grade
The composite is a weighted blend of 9 inputs, each scored 0–100. Each bar is that input's sub-score; the figure is the points it added to the 100-point composite (weight × sub-score).
- ARV discount +14.5/15.0
- Appreciation +10.0/10.0
- Cash flow +4.1/30.0
- Schools +4.1/10.0
- Livability +3.4/5.0
- Rent growth +2.5/5.0
- Condition / age +2.5/5.0
- 1% rule +1.8/10.0
- DSCR +0.0/10.0
$199,900
🖨 Deal sheet (PDF) 📄 Offer letter ✓ Due diligence
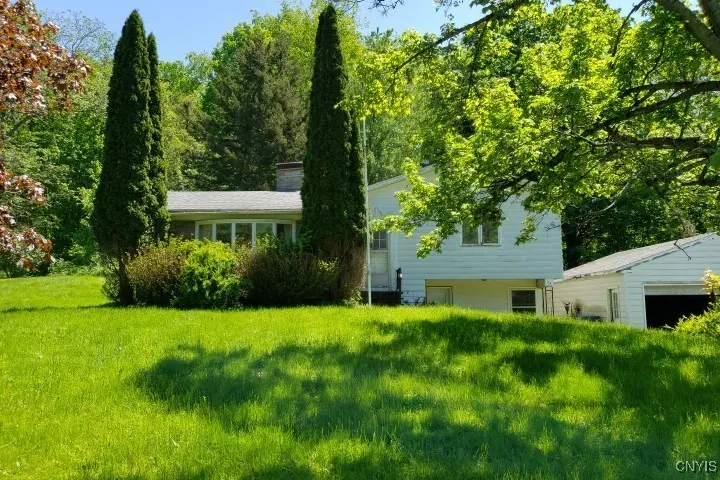
Listing remarks MLS
Amazing opportunity in the Phoenix School district. This Split-Level home features three bedrooms, two full bathrooms, living room dining room combo, kitchen and a partially finished basement. There are hardwood floors throughout. There is so much potential for this property. There is a detached 2 car garage. Sit in your back yard and sip your morning coffee. Enjoy the convenience of this great location, only minutes from I-481 for easy commuting.
Key facts
- 0.54 acre lot
- 2 garage spots
- Built 1965
Neighborhood map
What this means for you Summary
Snapshot
- This is a 3-bed/2.0-bath single-family listed at $200k.
Deal economics
- At list price, monthly cash flow is $-552 ($-7k/yr) — negative.
- To cash-flow at today's rent, offer at most $119k (40.2% below list).
- To meet the 1% rule (rent ≥ 1% of price), the offer needs to be $136k (31.8% below list).
- Recommended offer: $119k (40.2% below list) — sets the bar for cash-flow.
- Cap rate 3.0% vs local median 1.9% in Phoenix — top-decile yield for the area; either an underpriced asset or a hidden risk that comps aren't pricing in. Stress-test before assuming the spread holds.
Location & tenants
- Location reads 67/100 on livability (#613 in NY) — a middle-class / working-renter tenant base. Strengths: cost of living A+, housing A+, crime B+; Watch: employment C-, amenities F, commute F.
- Phoenix Central School District (suburban): math 45% / reading 51% proficiency, ranked #416 of 590 in NY (top 70%) — families likely to look elsewhere, expect single-tenant / working-renter base with shorter leases.
- Zoned schools: Michael A Maroun Elementary School (math 36% / reading 45%, grade F, #1,413 of 2,108 statewide, top 67%, 667 students, 58% FRL); Emerson J Dillon Middle School (math 35% / reading 40%, grade F, #445 of 729 statewide, top 61%, 514 students, 60% FRL); John C Birdlebough High School (math 87% / reading 87%, grade A, #311 of 1,100 statewide, top 30%, 473 students, 59% FRL) — zoned schools average 59% FRL vs 41% district-wide (18 pts higher); higher-poverty schools than district average — tighter screening recommended.
- Market conditions: 40 active listings in the ZIP; 172 units permitted in Oswego County in 2024 (27 in 5+ unit buildings).
Forward outlook
- In year one you build about $21k of equity ($1k loan paydown + $20k appreciation (10.0% local appreciation)).
- Oswego County population projected at -23% by 2050 — secular population decline; favor cash flow + early exit over multi-decade hold.
- By year 2, paydown + projected appreciation supports a ~$34k cash-out refi (75% LTV) — recoverable capital for the next deal without selling this one.
Negotiation context
- It's been on market 367 days — a 12% lower offer ($176k) is reasonable based on typical stale-listing flexibility.
- Current owner paid $117k; list at $200k implies a 71% gain — meaningful room to come down on a strong offer.
Risks & watch-outs
- Watch-outs: property tax is 3.0% of price.
Questions for the listing agent
- What do current leases actually rent for vs. the listed asking? Can we see a recent rent roll and the last 12 months of T-12 income?
- It's been on market 367 days. Have you received any prior offers? Is the seller open to a 40% concession, seller financing, or rate buy-down credit?
- Built in 1965 — when were the roof, HVAC, electrical panel, plumbing, and water heater last replaced?
- Property tax is high relative to price — has the assessment been appealed recently, and will the sale trigger a re-assessment?
- Why hasn't it sold? Are there any deal-killer items the seller is aware of (foundation, flood, title, zoning, code violations)?
- Is there a deadline driving the sale (1031 exchange, divorce, estate, relocation)? That informs how much negotiation room exists.
- The area grade is low — what's the realistic commute time and amenity access for the typical tenant pool here? Any planned neighborhood developments (good or bad) we should know about?
- What's the average days-on-market for RENTAL listings here right now (not sales)? A rising rental-DOM trend means longer vacancies and softer asking-rent achievability than the comps imply.
- What's the recent tenant-quality profile in this submarket — average credit score on applications, eviction rate, late-payment / NSF rate, and stable-employment percentage? A property-management company in the area should have these aggregated.
- How much new for-sale + rental construction is in the pipeline within 1–3 miles? Heavy new supply typically softens prices + rents 12–24 months out; constrained supply supports both.
Investment metrics
- 1% rule
- 0.68% ✗
- Cap rate
- 2.98%
- Cash-on-cash
- -11.84%
- DSCR
- 0.47
- GRM
- 12.2
CMA / ARV
- ARV (median comp)
- $236,431
- List price
- $199,900
- Delta
- -15.45%
- Verdict
- UNDERPRICED
- Comps
- 20 within 1.0 mi
Show comp detail 12 sales within ~0.75 mi
| Address | Dist | Beds/Ba | Sqft | Sold | Price | $/sf | Match |
|---|---|---|---|---|---|---|---|
| 379 Main St | 0.16mi | 3/2.0 | 1,696 (-2%) | 18mo | $190,000 | $112 | 74 |
| 27 Kay Pat Dr | 0.15mi | 3/2.0 | 1,580 (-8%) | 14mo | $257,000 | $163 | 67 |
| 30 Jefferson St | 0.28mi | 4/3.0 (+1) | 1,798 (+4%) | 8mo | $307,400 | $171 | 65 |
| 34 State St | 0.33mi | 3/2.0 | 1,800 (+4%) | 19mo | $233,160 | $130 | 62 |
| 40 Lock St | 0.39mi | 4/1.5 (+1) | 1,800 (+4%) | 9mo | $200,000 | $111 | 60 |
| 29 Loomis | 0.05mi | 4/2.0 (+1) | 1,964 (+14%) | 12mo | $253,000 | $129 | 60 |
| 14 Loomis Ter | 0.05mi | 2/1.5 (-1) | 1,470 (-15%) | 10mo | $220,000 | $150 | 58 |
| 10 Candee St | 0.51mi | 4/1.5 (+1) | 1,712 (-1%) | 15mo | $225,000 | $131 | 55 |
| 85 Lock St | 0.47mi | 4/1.5 (+1) | 1,854 (+7%) | 12mo | $232,500 | $125 | 48 |
| 67 Cherry St | 0.46mi | 4/1.5 (+1) | 1,470 (-15%) | 4mo | $200,900 | $137 | 44 |
| 10 Homestead Ave | 0.62mi | 3/2.0 | 1,548 (-10%) | 20mo | $225,000 | $145 | 37 |
| 36 Spring St | 0.74mi | 4/1.0 (+1) | 1,608 (-7%) | 18mo | $145,000 | $90 | 30 |
Match score weights: distance 35% · size 25% · config 20% · recency 20%. Top-matched comps best support the ARV.
Projected returns pro-forma
10.0% appreciation · 3.0% rent growth · sell at horizon
- IRR
- 16.0%
- Equity multiple
- 2.32×
- Total profit
- $73,871
- Equity at exit
- $180,086
- IRR
- 15.5%
- Equity multiple
- 5.39×
- Total profit
- $245,541
- Equity at exit
- $388,362
Cash invested: $55,972 (down + closing). Projections, not guarantees.
Landlord ↔ Tenant lean methodology
- Overall (STATE)
- 15 Strongly Tenant-Friendly
- State New York
- 15 Strongly Tenant-Friendly · D+10
- County
- — inherits STATE
- City
- — inherits STATE
ZIP-level market 13135
- Home prices YoY
- 8.8%
- Active inventory
- 40
- Price-to-rent
- 12.2×
Monthly cashflow live
- Estimated rent
- $1,364 medium interval (Pro) →
- Mortgage (P&I)
- −$1,048
- Tax from tax record
- −$498 /mo · $5,975/yr
- Insurance
- −$83
- HOA
- −$0
- Vacancy / Maint / Mgmt
- −$286
- Net cashflow
- $-552
Break-even live
Sensitivity live
| Price | -10% $-439 | -5% $-496 | +0% $-552 | +5% $-609 | +10% $-665 |
|---|---|---|---|---|---|
| Rent | -10% $-660 | -5% $-606 | +0% $-552 | +5% $-498 | +10% $-445 |
| Rate | -1.0pp $-452 | -0.5pp $-501 | base $-552 | +0.5pp $-604 | +1.0pp $-657 |
UW: 25.0% down · 7.5% · 30yr · 1.5% tax · 5.0% vac · 8.0% maint · 8.0% mgmt
Financing live
Cash to close
- Down payment
- $49,975
- Closing costs
- $5,997
- Reserves months
- —
- Total cash needed
- —
Loan-product check · same deal, 3 products live
Conventional
25% down · 7.5% · 30yr
- Down + closing
- —
- Monthly P&I
- —
- Monthly cashflow
- —
- DSCR
- —
- Eligible?
- —
Personal DTI + credit; lowest rate.
DSCR
20% down · 8.5% · 30yr
- Down + closing
- —
- Monthly P&I
- —
- Monthly cashflow
- —
- DSCR
- —
- Eligible?
- —
No personal income docs; deal must DSCR.
Hard money
10% down · 12.0% · 12mo
- Down + closing
- —
- Monthly P&I
- —
- Monthly cashflow
- —
- DSCR
- —
- Eligible?
- —
Short-term bridge; refi at stabilization.
Listing history 19 events
-
2026-06-21days on market $199,900 Active 367 DOM
-
2026-06-18days on market $199,900 Active 364 DOM
-
2026-06-17days on market $199,900 Active 363 DOM
-
2026-06-16days on market $199,900 Active 362 DOM
-
2026-06-15days on market $199,900 Active 361 DOM
-
2026-06-14days on market $199,900 Active 359 DOM
-
2026-06-13days on market $199,900 Active 358 DOM
-
2026-06-10days on market $199,900 Active 356 DOM
-
2026-06-09days on market $199,900 Active 355 DOM
-
2026-06-08days on market $199,900 Active 354 DOM
-
2026-06-07days on market $199,900 Active 353 DOM
-
2026-06-03days on market $199,900 Active 349 DOM
-
2026-06-02days on market $199,900 Active 348 DOM
-
2026-06-01days on market $199,900 Active 347 DOM
-
2026-05-31days on market $199,900 Active 346 DOM
-
2026-05-30days on market $199,900 Active 345 DOM
-
2025-09-17price $199,900 451-char remark
Show marketing remark (451 chars)
Amazing opportunity in the Phoenix School district. This Split-Level home features three bedrooms, two full bathrooms, living room dining room combo, kitchen and a partially finished basement. There are hardwood floors throughout. There is so much potential for this property. There is a detached 2 car garage. Sit in your back yard and sip your morning coffee. Enjoy the convenience of this great location, only minutes from I-481 for easy commuting.
-
2025-06-19$216,000 Active 451-char remark
Show marketing remark (451 chars)
Amazing opportunity in the Phoenix School district. This Split-Level home features three bedrooms, two full bathrooms, living room dining room combo, kitchen and a partially finished basement. There are hardwood floors throughout. There is so much potential for this property. There is a detached 2 car garage. Sit in your back yard and sip your morning coffee. Enjoy the convenience of this great location, only minutes from I-481 for easy commuting.
-
2006-05-16soldstatus $117,000
ⓘ Source: listings_history table (triggers on properties + properties_extension) + one-shot
backfill from property_details.listing_events for pre-trigger history.
Tax reassessment forecast NY · Partial reset (capped growth)
- Current annual tax
- $5,975 · $498/mo
- Projected year-2 tax
- $5,975 · $498/mo
- Expected delta
- $0/yr ($0/mo · 0.0%)
ⓘ Screening estimate from a state-policy table — verify with the county assessor before closing.
Climate risk First Street
- Flood 1/10 Low FEMA zone X (unshaded) · 0% chance over 30 yrs
- Wildfire 1/10 Low
- Heat 2/10 Low 7 d/yr ≥96°F today · 16 d/yr by 30 yrs out
- Wind 1/10 Low 0% chance of damaging wind over 30 yrs
- Air quality 2/10 Low 1 unhealthy d/yr today · 1 by 30 yrs out
Nearby sold comps map
Loading sold comps map…
Walkable amenities ~0.75 mi
Loading nearby amenities…
Taxation est. · year 1
- Rental income
- $16,363
- − Mortgage interest
- −$11,198
- − Property taxes
- −$5,975
- − Insurance
- −$1,000
- − Repairs & maintenance
- −$1,309
- − Management
- −$1,309
- − Depreciation
- −$5,815
- Taxable loss
- −$10,242
- Est. tax savings @ 24.0%
- +$2,458
- After-tax cash flow
- $-4,169/yr
For passive investors: Depreciation is non-cash, so a rental often shows a tax loss while cash-flowing — sheltering income. Rental losses are passive: they offset passive income freely, and up to $25,000/yr can offset ordinary (W-2) income if you actively participate and your MAGI is under $100k (phasing out to $0 by $150k); unused losses carry forward. On sale, claimed depreciation is recaptured at up to 25%, and gains may owe capital-gains tax (a 1031 exchange can defer both). Figures are a year-1 estimate at your 24.0% rate — not tax advice; consult a CPA.
Schools (NCES district)
- District
- Phoenix Central School District
- NCES district ID
- 3622920
- Math proficiency
- 45% ▼ -14.00%
- Reading proficiency
- 51% ▲ 5.00%
- Median HH income
- $52,419
- Composite
- 41.34/100
- National rank
- #3500
- State rank
- #416 of 590 in NY
Livability — Phoenix
- Score
- 67/100
- State rank
- #613
- US rank
- #11120
Category grades
Schools grade is shown separately in the Schools card above.
Census & demographics
- Census place
- Phoenix, NY
- Population (ZIP)
- 6,229
Population outlook (Oswego County) Hauer SSP2
- Today (2025)
- 114,465 people
- By 2030
- 109,968 · -3.9%
- By 2040
- 99,205 · -13.3%
- By 2050
- 87,979 · -23.1%
- By 2075
- 65,100 · -43.1%
- By 2100
- 47,117 · -58.8%
Race, ethnicity, and origin ACS 2023
- Neighborhood character
- Predominantly White (92%)
- Race & ethnicity
- White 92% Two or more races 5% Hispanic / Latino 2% Asian 2%
- Common ancestry
- Lithuanian 8% Romanian 5% Slovak 2%
- Foreign-born
- 2% · China, Vietnam
- Languages at home
- 97% English-only · Russian/Polish/Slavic 1% Vietnamese 1%
Political lean MEDSL · Oswego
- 2024 margin
- Strong R (+24.2) · D 37.9% · R 62.1%
- 2008→2024 swing
- -26.6pp toward R · 2008: 2.5pp · 2024: -24.2pp
- All cycles
- 2024: R+24.2 2020: R+20.2 2016: R+23.2 2012: D+7.9 2008: D+2.5
Not yet ingested
- Civics
- —
Market trends
- HPI YoY
- ▲ 25.32%
- Current HPI
- 313.5591
- Rent YoY
- —
- Metro
- —
- State GDP YoY
- ▲ 2.60%
- F500 in state
- 92
Industry mix (Fortune 500 HQ in NY)
| Industry | F500 HQs | Revenue |
|---|---|---|
| Financial Services | 10 | $950B |
|
||
| Consumer Goods | 9 | $162B |
|
||
| Insurance | 4 | $225B |
|
||
| Telecommunications | 2 | $144B |
|
||
| Pharmaceuticals | 2 | $112B |
|
||
| Media / Entertainment | 2 | $69B |
|
||
Price history
+70.9% since first listed3 events — show timeline
- 2025-09-17 Price Changed $199,900 CNYIS
- 2025-06-19 Listed $216,000 CNYIS
- 2006-05-16 Sold (Public Records) $117,000 Public Records
Property tax history
-1.8%/yrLatest (2025): $5,975 · -0.6% YoY. Source: county tax records.
Cash-flow waterfall
monthlySold comps — $/sqft
last 12 mo · ≤1 miLoading sold comps…