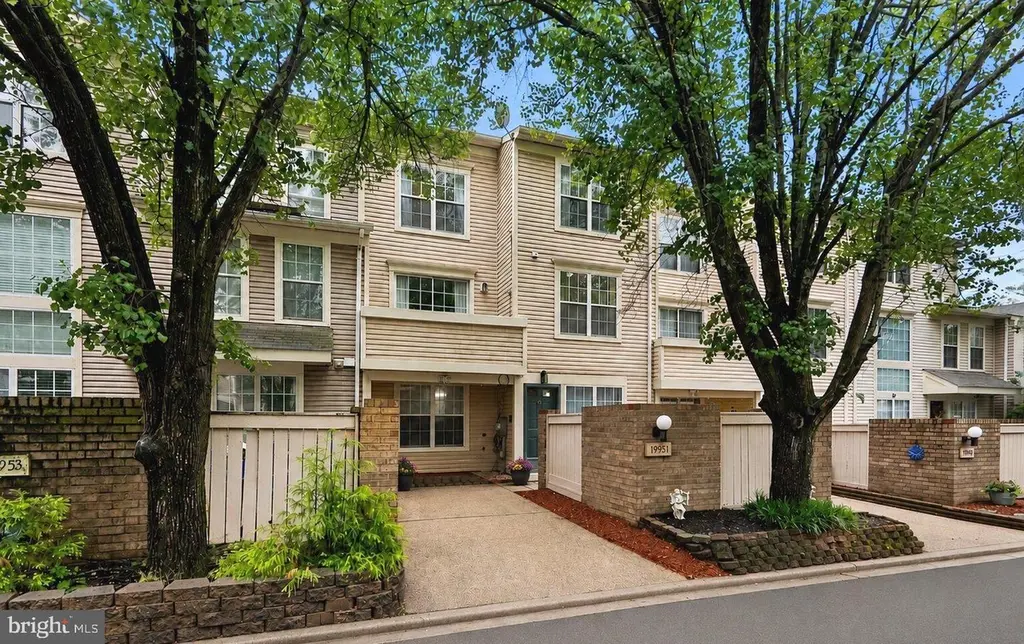
19951 Drexel Hill Cir
Montgomery Village, MD 20886
$370,000D
3 bd · 2.5 ba ·
1,593 sqft ·
Built 1988
· Townhouse
· Pending
· 7 DOM
Cashflow @ list (25.0% down · 7.5%)
Estimated rent
$2,914/mo
Mortgage (P&I)
−$1,940
Tax + insurance
−$437
HOA
−$138
Vac / Maint / Mgmt
−$612
Net cashflow
$-213/mo
Annual
$-2,552/yr
Cap rate
5.60%
Cash-on-cash
-2.46%
DSCR
0.89
1% rule
0.79%
Cash to close
$103,600
Investor read
- This is a 3-bed/2.5-bath townhouse listed at $370k.
- At list price, monthly cash flow is $-213 ($-3k/yr) — negative.
- To cash-flow at today's rent, offer at most $332k (10.2% below list).
- To meet the 1% rule (rent ≥ 1% of price), the offer needs to be $291k (21.2% below list).
- Only 7 days on market — expect competitive offers; lowballing is unlikely to land.
- Recommended offer: $291k (21.2% below list) — sets the bar for 1% rule.
- Local home prices are declining (-1.0%/yr); year-one equity from $3k of loan paydown is wiped out by about $4k of value loss. Plan a longer hold.
- Location reads 62/100 on livability (#318 in MD) — a middle-class / working-renter tenant base. Strengths: employment A+, housing A+; Watch: schools F, crime D-, amenities F.
- Montgomery County Public Schools (suburban): math 27% / reading 45% proficiency, ranked #3 of 24 in MD (top 12%) — families likely to look elsewhere, expect single-tenant / working-renter base with shorter leases.
- Market conditions: Rents rising fast (+4.3%/yr); 123 active listings in the ZIP; 40 comparable units currently listed for rent nearby; rentals lingering (median 44d on market — plan ~5-8 weeks vacancy on turnover, expect pricing pressure); 50% of comp listings sitting > 30 days — soft ceiling on asking rent; solid renter incomes; 3,880 units permitted in Montgomery County in 2024 (2,054 in 5+ unit buildings).
- Montgomery County population projected at +27% by 2050 — long-run rental-demand tailwind backs the buy-and-hold thesis.
- 7 sale attempts since 30y ago; this cycle's ask is 51% above the opening price — seller raised mid-cycle; expect resistance to lowballs.
- Current owner paid $217k; list at $370k implies a 71% gain — meaningful room to come down on a strong offer.
- Climate carrying-cost: extreme-heat days projected 7→16/yr by 2055 (HVAC capex compounding) — expect insurance premiums to compound above CPI over the hold.
- Cap rate 5.6% vs local median 4.2% in Montgomery Village — top-decile yield for the area; either an underpriced asset or a hidden risk that comps aren't pricing in. Stress-test before assuming the spread holds.
- This rent runs 35% of the median local income ($99k/yr) — at the standard rent-burdened threshold; future hikes will face affordability resistance.
Questions for listing agent
- What do current leases actually rent for vs. the listed asking? Can we see a recent rent roll and the last 12 months of T-12 income?
- What does the HOA fee cover, when was the last increase, and are there any pending special assessments or reserve-fund shortfalls?
- Is there a deadline driving the sale (1031 exchange, divorce, estate, relocation)? That informs how much negotiation room exists.
- Schools are F-rated, which usually means shorter tenancies and higher turnover. Who's the typical renter profile here, and what's been the actual vacancy rate?
- Crime grade is D in this area — have there been break-ins, vandalism, or insurance claims at this property in the last 3 years? What carrier currently insures it and at what premium?
- The area grade is low — what's the realistic commute time and amenity access for the typical tenant pool here? Any planned neighborhood developments (good or bad) we should know about?
- What's the average days-on-market for RENTAL listings here right now (not sales)? A rising rental-DOM trend means longer vacancies and softer asking-rent achievability than the comps imply.
- What's the recent tenant-quality profile in this submarket — average credit score on applications, eviction rate, late-payment / NSF rate, and stable-employment percentage? A property-management company in the area should have these aggregated.
CashFlowRE · CFR-J77CPR7FQQYA3Z
· Data 1 week ago
cashflowre.app · 2026-05-29