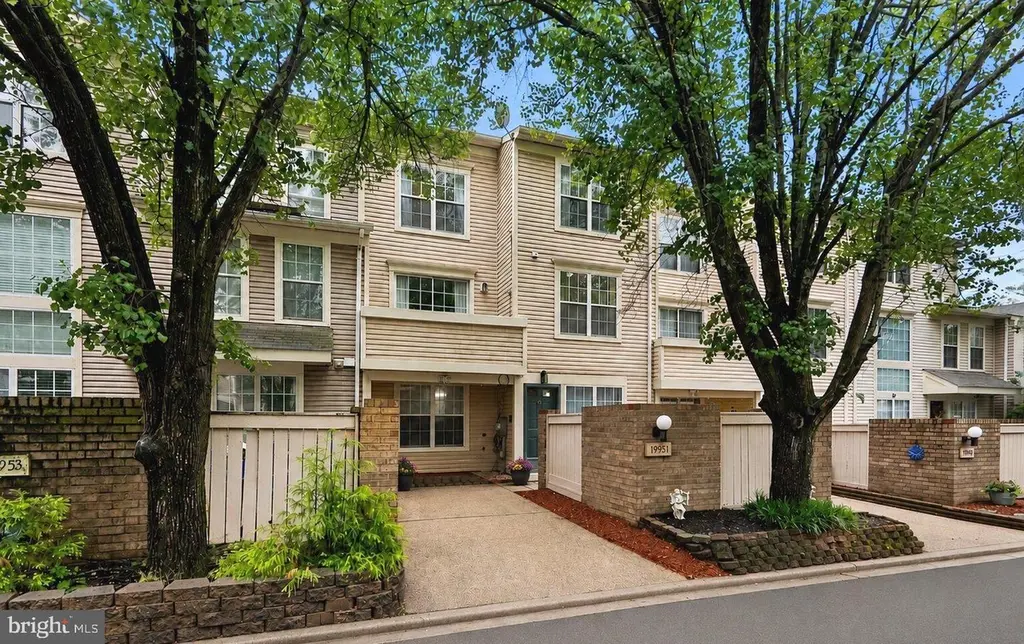
19951 Drexel Hill Cir · Montgomery Village, MD
Flood risk 1/10 · Minimal
- FEMA flood zone
- X (unshaded)
- Chance of flooding over 30 yrs
- 0.0%
- Est. flood insurance / yr
- $507 – $1,088
Fire risk 1/10 · Minimal
- Est. fire insurance / yr
- $755 – $1,403
Heat risk 6/10 · Moderate
- Hot days now (above 102°F)
- 7 days/yr
- Hot days in 30 yrs
- 16 days/yr
Wind risk 4/10 · Minor
- Chance of severe wind over 30 yrs
- 11.0%
Air-quality risk 2/10 · Minimal
- Unhealthy air days now
- 2 days/yr
- Unhealthy air days in 30 yrs
- 2 days/yr
Risk factors via First Street. Map © Google.
Why this score? — see what drove the D grade
The composite is a weighted blend of 9 inputs, each scored 0–100. Each bar is that input's sub-score; the figure is the points it added to the 100-point composite (weight × sub-score).
- ARV discount +10.9/15.0
- Cash flow +10.2/30.0
- Appreciation +4.5/10.0
- Rent growth +3.6/5.0
- Schools +3.6/10.0
- Livability +3.1/5.0
- 1% rule +2.9/10.0
- DSCR +2.9/10.0
- Condition / age +2.5/5.0
$370,000
🖨 Deal sheet 📄 Offer letter ✓ Due diligence
Listing remarks MLS
Sunfilled home, a spacious master suite with a separate shower and a whirlpool tub, also from the master bedroom a balcony to sit and relax, on the 2nd level you also have a sitting /home office area, the 3rd level has two nicely sized bedrooms and features a 2 story skylighted atrium. This Home is eligible for Freddie Mac's 1st Look Initiative. Only Offers from Owner Occupant buyers will be reviewed during the first 20 days on the market (through Dec 19, 2019). Investors may submit offers starting Dec. 20, 2019.. . Great price and great location. The seller is exempt from ALL disclosures as well as T & R Taxes, buyer MUST pay 100%For more information text "6209681" to 79564.
Key facts
- $138 HOA
- Community pool
- Built 1988
Property features AI
Finance
- Other: Front foot fee paid annually
- HOA & community: Monthly HOA fee of $138; HOA covers common area maintenance, management, pool(s), road maintenance, reserve funds, snow removal, and trash; Community amenities include bike trail, common grounds, community center, jog/walk path, lake, outdoor pool, picnic area, playground, tennis courts, and swimming pool
Exterior
- Parking: Driveway; On-street parking
- Utilities: Public water; Public sewer; Electric utilities
- Home design: Interior townhouse/rowhouse; Fee simple ownership
- Construction: Slab foundation
- Exterior features: Community pool; Above-grade and below-grade other structures; Not on tidal water
Interior
- Bedrooms: One bedroom on the first upper level; Two bedrooms on the second upper level
- Bathrooms: Two full bathrooms on upper levels; One full bathroom on first upper level; One half bathroom on main level; One half bathroom total
- Heating & cooling: Central heating (electric); Central air conditioning (electric); Electric hot water
- Interior features: No basement; Living area per assessor
Neighborhood map
What this means for you Summary
Snapshot
- This is a 3-bed/2.5-bath townhouse listed at $370k.
Deal economics
- At list price, monthly cash flow is $-213 ($-3k/yr) — negative.
- To cash-flow at today's rent, offer at most $332k (10.2% below list).
- To meet the 1% rule (rent ≥ 1% of price), the offer needs to be $291k (21.2% below list).
- Recommended offer: $291k (21.2% below list) — sets the bar for 1% rule.
- Cap rate 5.6% vs local median 4.2% in Montgomery Village — top-decile yield for the area; either an underpriced asset or a hidden risk that comps aren't pricing in. Stress-test before assuming the spread holds.
Location & tenants
- Location reads 62/100 on livability (#318 in MD) — a middle-class / working-renter tenant base. Strengths: employment A+, housing A+; Watch: schools F, crime D-, amenities F.
- Montgomery County Public Schools (suburban): math 27% / reading 45% proficiency, ranked #3 of 24 in MD (top 12%) — families likely to look elsewhere, expect single-tenant / working-renter base with shorter leases.
- Market conditions: Rents rising fast (+4.3%/yr); 123 active listings in the ZIP; 40 comparable units currently listed for rent nearby; rentals lingering (median 44d on market — plan ~5-8 weeks vacancy on turnover, expect pricing pressure); 50% of comp listings sitting > 30 days — soft ceiling on asking rent; solid renter incomes; 3,880 units permitted in Montgomery County in 2024 (2,054 in 5+ unit buildings).
- This rent runs 35% of the median local income ($99k/yr) — at the standard rent-burdened threshold; future hikes will face affordability resistance.
Forward outlook
- Local home prices are declining (-1.0%/yr); year-one equity from $3k of loan paydown is wiped out by about $4k of value loss. Plan a longer hold.
- Montgomery County population projected at +27% by 2050 — long-run rental-demand tailwind backs the buy-and-hold thesis.
Negotiation context
- Only 7 days on market — expect competitive offers; lowballing is unlikely to land.
- 7 sale attempts since 30y ago; this cycle's ask is 51% above the opening price — seller raised mid-cycle; expect resistance to lowballs.
- Current owner paid $217k; list at $370k implies a 71% gain — meaningful room to come down on a strong offer.
Risks & watch-outs
- Climate carrying-cost: extreme-heat days projected 7→16/yr by 2055 (HVAC capex compounding) — expect insurance premiums to compound above CPI over the hold.
Questions for the listing agent
- What do current leases actually rent for vs. the listed asking? Can we see a recent rent roll and the last 12 months of T-12 income?
- What does the HOA fee cover, when was the last increase, and are there any pending special assessments or reserve-fund shortfalls?
- Is there a deadline driving the sale (1031 exchange, divorce, estate, relocation)? That informs how much negotiation room exists.
- Schools are F-rated, which usually means shorter tenancies and higher turnover. Who's the typical renter profile here, and what's been the actual vacancy rate?
- Crime grade is D in this area — have there been break-ins, vandalism, or insurance claims at this property in the last 3 years? What carrier currently insures it and at what premium?
- The area grade is low — what's the realistic commute time and amenity access for the typical tenant pool here? Any planned neighborhood developments (good or bad) we should know about?
- What's the average days-on-market for RENTAL listings here right now (not sales)? A rising rental-DOM trend means longer vacancies and softer asking-rent achievability than the comps imply.
- What's the recent tenant-quality profile in this submarket — average credit score on applications, eviction rate, late-payment / NSF rate, and stable-employment percentage? A property-management company in the area should have these aggregated.
- How much new for-sale + rental construction is in the pipeline within 1–3 miles? Heavy new supply typically softens prices + rents 12–24 months out; constrained supply supports both.
Investment metrics
- 1% rule
- 0.79% ✗
- Cap rate
- 5.60%
- Cash-on-cash
- -2.46%
- DSCR
- 0.89
- GRM
- 10.6
CMA / ARV
- ARV (on-the-fly)
- $399,843
- Comps found
- 12
Show comp detail 12 sales within ~0.75 mi
| Address | Dist | Beds/Ba | Sqft | Sold | Price | $/sf | Match |
|---|---|---|---|---|---|---|---|
| 8804 Rustburg Cir | 0.01mi | 3/2.5 | 1,593 (0%) | 1mo | $398,000 | $250 | 98 |
| 8807 Rustburg Cir | 0.04mi | 3/2.5 | 1,593 (0%) | 2mo | $400,000 | $251 | 97 |
| 19928 Sugar Notch Cir | 0.05mi | 3/2.5 | 1,593 (0%) | 2mo | $385,000 | $242 | 96 |
| 20003 Canebrake Ct | 0.08mi | 3/2.5 | 1,677 (+5%) | 1mo | $330,000 | $197 | 87 |
| 8812 Sturbridge Pl | 0.03mi | 3/2.5 | 1,677 (+5%) | 5mo | $399,900 | $238 | 85 |
| 8412 Burchap Dr | 0.29mi | 3/3.5 | 1,600 (+0%) | 1mo | $507,500 | $317 | 81 |
| 8500 Hawk Run Ter | 0.23mi | 4/3.5 (+1) | 1,620 (+2%) | 5mo | $465,000 | $287 | 74 |
| 9123 Chesley Knoll Ct | 0.42mi | 3/1.5 | 1,548 (-3%) | 2mo | $342,000 | $221 | 70 |
| 8647 Hawk Run Ter | 0.19mi | 3/3.5 | 1,740 (+9%) | 4mo | $440,000 | $253 | 68 |
| 19812 Billings Ct | 0.64mi | 3/2.5 | 1,529 (-4%) | 1mo | $425,000 | $278 | 62 |
| 20017 Spur Hill Dr | 0.53mi | 3/2.5 | 1,457 (-8%) | 1mo | $398,000 | $273 | 61 |
| 20213 Lea Pond | 0.56mi | 4/2.0 (+1) | 1,750 (+10%) | 6mo | $419,000 | $239 | 45 |
Match score weights: distance 35% · size 25% · config 20% · recency 20%. Top-matched comps best support the ARV.
Projected returns pro-forma
-0.98% appreciation · 4.27% rent growth · sell at horizon
- IRR
- -8.2%
- Equity multiple
- 0.64×
- Total profit
- $-37,214
- Equity at exit
- $89,742
- IRR
- -0.3%
- Equity multiple
- 0.97×
- Total profit
- $-3,340
- Equity at exit
- $94,601
Cash invested: $103,600 (down + closing). Projections, not guarantees.
Landlord ↔ Tenant lean methodology
- Overall (STATE)
- 27 Tenant-Leaning
- State Maryland
- 27 Tenant-Leaning · D+14
- County
- — inherits STATE
- City
- — inherits STATE
ZIP-level market 20886
- Home prices YoY
- -0.4%
- Rents YoY
- 4.3%
- Active inventory
- 123
- Price-to-rent
- 10.6×
Monthly cashflow live
- Estimated rent
- $2,914 high interval (Pro) →
- Mortgage (P&I)
- −$1,940
- Tax from tax record
- −$283 /mo · $3,391/yr
- Insurance
- −$154
- HOA
- −$138
- Vacancy / Maint / Mgmt
- −$612
- Net cashflow
- $-213
Break-even live
UW: 25.0% down · 7.5% · 30yr · 1.5% tax · 5.0% vac · 8.0% maint · 8.0% mgmt
Financing live
Cash to close
- Down payment
- $92,500
- Closing costs
- $11,100
- Reserves months
- —
- Total cash needed
- —
Loan-product check · same deal, 3 products live
Conventional
25% down · 7.5% · 30yr
- Down + closing
- —
- Monthly P&I
- —
- Monthly cashflow
- —
- DSCR
- —
- Eligible?
- —
Personal DTI + credit; lowest rate.
DSCR
20% down · 8.5% · 30yr
- Down + closing
- —
- Monthly P&I
- —
- Monthly cashflow
- —
- DSCR
- —
- Eligible?
- —
No personal income docs; deal must DSCR.
Hard money
10% down · 12.0% · 12mo
- Down + closing
- —
- Monthly P&I
- —
- Monthly cashflow
- —
- DSCR
- —
- Eligible?
- —
Short-term bridge; refi at stabilization.
Rent comps 40 comps
| Address | Beds | Baths | Sqft | Rent | $/sqft | DOM | Units | Dist |
|---|---|---|---|---|---|---|---|---|
| 8711 Ravenglass Way Montgomery Village, MD | 3.0 | 3.5 | 1470 | $2,600 | $1.77 | 43d | 1 | 0.18mi |
| 8851 Welbeck Way Montgomery Village, MD | 3.0 | 2.5 | 1300 | $2,972 | $2.29 | 43d | 1 | 0.20mi |
| 8874 Welbeck Way Gaithersburg, MD | 4.0 | 2.5 | 1254 | $2,450 | $1.95 | 20d | 1 | 0.21mi |
| 8785 Ravenglass Way Montgomery Village, MD | 2.0 | 3.5 | 1402 | $2,800 | $2.00 | 43d | 1 | 0.23mi |
| 8719 Delcris Dr Montgomery Village, MD | 3.0 | 2.5 | 2222 | $4,000 | $1.80 | 43d | 1 | 0.35mi |
| 9226 Weathervane Pl Montgomery Village, MD | 3.0 | 2.5 | 1739 | $2,750 | $1.58 | 18d | 1 | 0.57mi |
| 9226 Weathervane Pl Unit 1 Gaithersburg, MD | 3.0 | 3.0 | 1739 | $2,750 | $1.58 | 18d | 1 | 0.57mi |
| 9343 Bremerton Way Montgomery Village, MD | 3.0 | 2.5 | 1457 | $3,150 | $2.16 | 17d | 1 | 0.59mi |
| 9402 Quill Pl Montgomery Village, MD | 4.0 | 2.5 | 2100 | $2,700 | $1.29 | 43d | 1 | 0.68mi |
| 20305 Grazing Way Montgomery Village, MD | 4.0 | 3.5 | 1093 | $2,500 | $2.29 | 43d | 1 | 0.69mi |
| 19505 Turtle Dove Ter Gaithersburg, MD | 3.0 | 2.5 | 2002 | $2,900 | $1.45 | 43d | 1 | 0.76mi |
| 9639 Tall Oaks Rd Montgomery Village, MD | 3.0 | 2.5 | 1776 | $3,400 | $1.91 | 43d | 1 | 0.76mi |
| 9599 Tall Oaks Rd Montgomery Village, MD | 3.0 | 2.5 | 1760 | $3,250 | $1.85 | 18d | 1 | 0.81mi |
| 20559 Strath Haven Dr Montgomery Village, MD | 2.0 | 2.0 | 1260 | $2,300 | $1.83 | 43d | 1 | 0.82mi |
| 9583 Tall Oaks Rd Montgomery Village, MD | 4.0 | 2.5 | 1760 | $3,480 | $1.98 | 24d | 1 | 0.83mi |
| 9537 Tall Oaks Rd Montgomery Village, MD | 3.0 | 2.5 | 1760 | $3,390 | $1.93 | 15d | 1 | 0.90mi |
| 9377 Chadburn Pl Unit 9377 Gaithersburg, MD | 4.0 | 2.5 | 1083 | $2,600 | $2.40 | 43d | 1 | 0.90mi |
| 19533 Sol PL Gaithersburg, MD | 3.0 | 2.5 | 1978 | $3,499 | $1.77 | 43d | 1 | 0.94mi |
| 19753 Green Village Dr Montgomery Village, MD | 3.0 | 2.5 | 1936 | $3,350 | $1.73 | 2d | 1 | 1.01mi |
| 19753 Green Village Dr Unit 1 Montgomery Village, MD | 3.0 | 2.5 | 1936 | $3,375 | $1.74 | 2d | 1 | 1.01mi |
| 20323 Swallow Point Rd Montgomery Village, MD | 3.0 | 2.5 | 1888 | $3,250 | $1.72 | 22d | 1 | 1.09mi |
| 9848 Brookridge Ct Montgomery Village, MD | 3.0 | 2.5 | 1188 | $2,350 | $1.98 | 7d | 1 | 1.14mi |
| 9852 Brookridge Ct Montgomery Village, MD | 3.0 | 2.5 | 1188 | $2,585 | $2.18 | 5d | 1 | 1.14mi |
| 19349 Keymar Way Montgomery Village, MD | 3.0 | 1.5 | 1244 | $2,200 | $1.77 | 43d | 1 | 1.14mi |
| 9814 Brookridge Ct Montgomery Village, MD | 3.0 | 2.0 | 1188 | $2,550 | $2.15 | 43d | 1 | 1.18mi |
| 19002 Quail Valley Blvd Gaithersburg, MD | 4.0 | 2.0 | 1618 | $2,900 | $1.79 | 43d | 1 | 1.18mi |
| 9652 Marston Ln Montgomery Village, MD | 3.0 | 1.5 | 1320 | $2,700 | $2.05 | 3d | 1 | 1.18mi |
| 9317 Broadwater Dr Gaithersburg, MD | 3.0 | 3.5 | 1760 | $2,590 | $1.47 | 43d | 1 | 1.20mi |
| 19404 Transhire Rd Montgomery Village, MD | 4.0 | 2.5 | 1754 | $2,600 | $1.48 | 43d | 1 | 1.20mi |
| 19443 Brassie Pl #19443 Montgomery Village, MD | 2.0 | 2.0 | 1050 | $2,000 | $1.90 | 18d | 1 | 1.22mi |
| 9932 Tambay Ct Montgomery Village, MD | 3.0 | 2.5 | 1584 | $2,900 | $1.83 | 43d | 1 | 1.24mi |
| 19423 Brassie Pl #201 Montgomery Village, MD | 3.0 | 2.0 | 1050 | $2,300 | $2.19 | 43d | 1 | 1.29mi |
| 10006 Forest View Pl Montgomery Village, MD | 3.0 | 2.5 | 1188 | $2,199 | $1.85 | 12d | 1 | 1.32mi |
| 9992 Forest View Pl Montgomery Village, MD | 4.0 | 2.5 | 1212 | $2,259 | $1.86 | 12d | 1 | 1.33mi |
| 18925 Lindenhouse Rd Gaithersburg, MD | 4.0 | 2.5 | 2245 | $3,390 | $1.51 | 22d | 1 | 1.33mi |
| 19426 Brassie Pl Montgomery Village, MD | 2.0 | 1.5 | 1080 | $1,995 | $1.85 | 43d | 1 | 1.34mi |
| 19323 Club House Rd #101 Montgomery Village, MD | 2.0 | 2.0 | 1050 | $1,845 | $1.76 | 11d | 1 | 1.35mi |
| 9826 Posterity Ln Montgomery Village, MD | 3.0 | 3.5 | 1600 | $3,300 | $2.06 | 7d | 1 | 1.37mi |
| 19319 Club House Rd #101 Gaithersburg, MD | 2.0 | 2.0 | 1050 | $2,220 | $2.11 | 20d | 1 | 1.39mi |
| 19708 Preservation Mews Montgomery Village, MD | 3.0 | 3.5 | 1680 | $3,050 | $1.82 | 43d | 1 | 1.40mi |
HOA detail
- Monthly dues
- $138 · $1,656/yr
- Likely covers
- pool
Listing history 9 events
-
2026-06-13statusdays on market $370,000 Pending 7 DOM
-
2026-06-09days on market $370,000 Active 6 DOM
-
2026-06-08days on market $370,000 Active 5 DOM
-
2026-06-07days on market $370,000 Active 4 DOM
-
2026-06-04statusdays on market $370,000 Active 1 DOM
-
2026-06-03days on market $370,000 Coming Soon 5 DOM
-
2026-06-02days on market $370,000 Coming Soon 4 DOM
-
2026-06-01days on market $370,000 Coming Soon 3 DOM
-
2026-05-31days on market $370,000 Coming Soon 2 DOM
ⓘ Source: listings_history table (triggers on properties + properties_extension) + one-shot
backfill from property_details.listing_events for pre-trigger history.
Tax reassessment forecast MD · Partial reset (capped growth)
- Current annual tax
- $3,391 · $283/mo
- Projected year-2 tax
- $3,712 · $309/mo
- Expected delta
- +$321/yr (+$27/mo · 9.5%)
ⓘ Screening estimate from a state-policy table — verify with the county assessor before closing.
Climate risk First Street
- Flood 1/10 Low FEMA zone X (unshaded) · 0% chance over 30 yrs
- Wildfire 1/10 Low
- Heat 6/10 Major 7 d/yr ≥102°F today · 16 d/yr by 30 yrs out
- Wind 4/10 Moderate 11% chance of damaging wind over 30 yrs
- Air quality 2/10 Low 2 unhealthy d/yr today · 2 by 30 yrs out
Nearby sold comps map
Loading sold comps map…
Walkable amenities ~0.75 mi
Loading nearby amenities…
Taxation est. · year 1
- Rental income
- $34,973
- − Mortgage interest
- −$20,726
- − Property taxes
- −$3,391
- − Insurance
- −$1,850
- − Repairs & maintenance
- −$2,798
- − Management
- −$2,798
- − HOA
- −$1,656
- − Depreciation
- −$10,764
- Taxable loss
- −$9,009
- Est. tax savings @ 24.0%
- +$2,162
- After-tax cash flow
- $-390/yr
For passive investors: Depreciation is non-cash, so a rental often shows a tax loss while cash-flowing — sheltering income. Rental losses are passive: they offset passive income freely, and up to $25,000/yr can offset ordinary (W-2) income if you actively participate and your MAGI is under $100k (phasing out to $0 by $150k); unused losses carry forward. On sale, claimed depreciation is recaptured at up to 25%, and gains may owe capital-gains tax (a 1031 exchange can defer both). Figures are a year-1 estimate at your 24.0% rate — not tax advice; consult a CPA.
Schools (NCES district)
- District
- Montgomery County Public Schools
- NCES district ID
- 2400480
- Math proficiency
- 27% ▼ -21.00%
- Reading proficiency
- 45% ▼ -10.00%
- Median HH income
- $97,191
- Composite
- 35.62/100
- National rank
- #4889
- State rank
- #3 of 24 in MD
Livability — Montgomery Village
- Score
- 62/100
- State rank
- #318
- US rank
- #16536
Category grades
Schools grade is shown separately in the Schools card above.
Census & demographics
- Census place
- Montgomery Village, MD
- County
- Montgomery County · 961,106 people
- City population
- 34,718
- Metro
- Washington-Arlington-Alexandria, DC-VA-MD-WV
- Population (ZIP)
- 34,718
- Household income
- $98,542
- Rent vs Own
- Severe rent burden
- 1600.0
Population outlook (Montgomery County) Hauer SSP2
- Today (2025)
- 1,173,231 people
- By 2030
- 1,237,402 · +5.5%
- By 2040
- 1,365,115 · +16.4%
- By 2050
- 1,491,592 · +27.1%
- By 2075
- 1,803,893 · +53.8%
- By 2100
- 2,035,619 · +73.5%
Race, ethnicity, and origin ACS 2023
- Neighborhood character
- Highly diverse neighborhood (Simpson 0.75)
- Race & ethnicity
- Hispanic / Latino 35% Black 23% White 23% Asian 14% Two or more races 12% Native American 1%
- Hispanic origin (detail)
- Mexican 2% Puerto Rican 2% Dominican 1%
- Common ancestry
- Romanian 1% Estonian 1% Lithuanian 1%
- Foreign-born
- 35% · Canada, China, Guatemala
- Languages at home
- 46% English-only · Spanish 32% Other Indo-European 6% French/Haitian/Cajun 3%
Political lean MEDSL · Montgomery
- 2024 margin
- Solid D (+53.3) · D 75.2% · R 21.9% · Other 2.9%
- 2008→2024 swing
- +8.7pp toward D · 2008: 44.6pp · 2024: 53.3pp
- All cycles
- 2024: D+53.3 2020: D+59.6 2016: D+55.5 2012: D+43.4 2008: D+44.6
Not yet ingested
- Civics
- —
Market trends
- HPI YoY
- ▼ -0.98%
- Current HPI
- 272.9687
- Rent YoY
- ▲ 4.27%
- Metro
- Washington-Arlington-Alexandria, DC-VA-MD-WV
- State GDP YoY
- ▲ 2.97%
- F500 in state
- 12
Industry mix (Fortune 500 HQ in MD)
| Industry | F500 HQs | Revenue |
|---|---|---|
| Aerospace / Defense | 1 | $71B |
|
||
| Utilities | 1 | $25B |
|
||
| Hotels | 1 | $24B |
|
||
| Consumer Goods | 1 | $7B |
|
||
| Real Estate | 1 | $6B |
|
||
| Chemicals | 1 | $2B |
|
||
Price history
+263.1% since first listed28 events — show timeline
- 2026-05-29 Coming Soon $370,000 BRIGHT MLS
- 2020-02-14 Contingent — BRIGHT MLS
- 2020-02-14 Listing Removed — BRIGHT MLS
- 2020-02-13 Sold (MLS) $217,000 BRIGHT MLS
- 2020-01-10 Relisted — BRIGHT MLS
- 2020-01-06 Listing Removed — BRIGHT MLS
- 2019-12-26 Price Changed $219,900 BRIGHT MLS
- 2019-12-21 Listed $244,900 BRIGHT MLS
- 2019-12-10 Listing Removed — BRIGHT MLS
- 2019-11-29 Listed $244,900 BRIGHT MLS
- 2006-05-22 Sold (Public Records) $319,000 Public Records
- 2006-05-12 Sold (MLS) $319,000 MRIS
- 2006-04-17 Delisted — MRIS
- 2006-04-13 Listed $319,000 MRIS
- 2002-11-21 Sold (Public Records) $160,000 Public Records
- 2002-06-27 Sold (MLS) $160,000 MRIS
- 2002-06-02 Delisted — MRIS
- 2002-05-31 Listed $160,000 MRIS
- 1999-05-07 Sold (Public Records) $112,000 Public Records
- 1999-04-29 Sold (MLS) $112,000 MRIS
- 1999-03-03 Delisted — MRIS
- 1998-07-13 Listed $109,944 MRIS
- 1996-07-01 Sold (Public Records) $119,900 Public Records
- 1996-06-24 Sold (MLS) $119,900 MRIS
- 1996-04-20 Delisted — MRIS
- 1996-01-29 Listed $119,900 MRIS
- 1991-12-18 Sold (Public Records) $116,500 Public Records
- 1988-02-05 Sold (Public Records) $101,910 Public Records
Property tax history
+3.7%/yrLatest (2025): $3,391 · +13.8% YoY. Source: county tax records.
Cash-flow waterfall
monthlySold comps — $/sqft
last 12 mo · ≤1 miLoading sold comps…