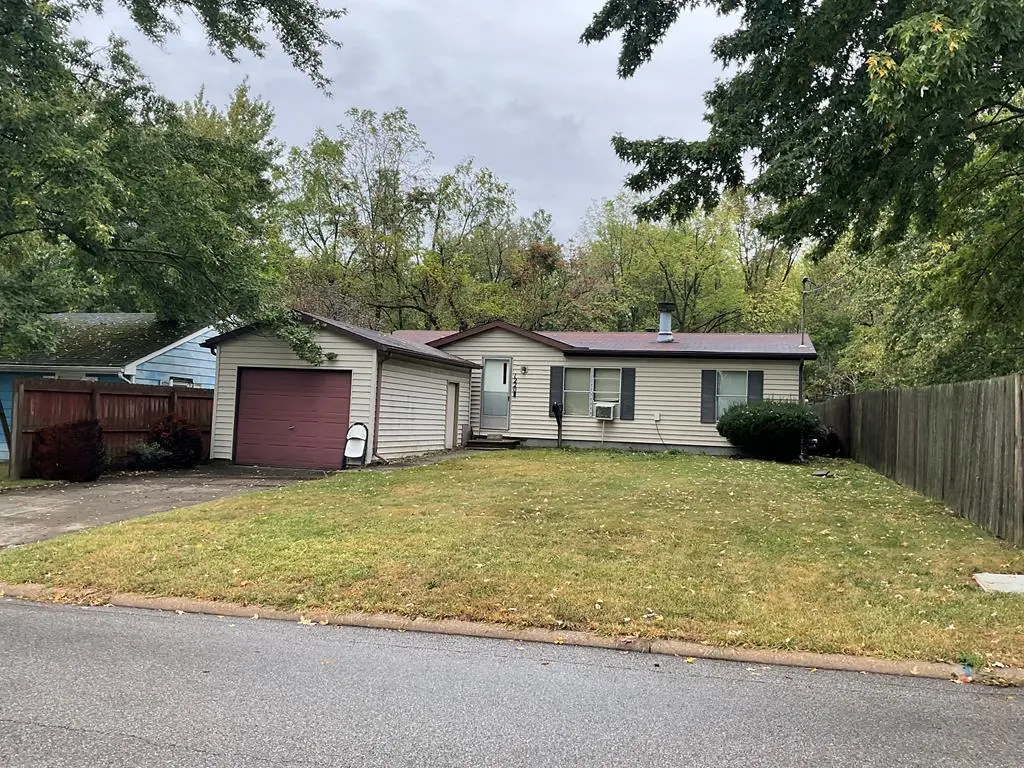
1220 E Warren St
Bucyrus, OH 44820
$85,000D+
2 bd · 1.0 ba ·
960 sqft ·
Built 1988
· SingleFamily
· Active
· 258 DOM
Cashflow @ list (25.0% down · 7.5%)
Estimated rent
$745/mo
Mortgage (P&I)
−$446
Tax + insurance
−$146
HOA
−$0
Vac / Maint / Mgmt
−$156
Net cashflow
$-3/mo
Annual
$-34/yr
Cap rate
6.25%
Cash-on-cash
-0.14%
DSCR
0.99
1% rule
0.88%
Cash to close
$23,800
Investor read
- This is a 2-bed/1.0-bath single-family listed at $85k.
- At list price, monthly cash flow is $-3 ($-34/yr) — negative.
- To cash-flow at today's rent, offer at most $85k (0.6% below list).
- To meet the 1% rule (rent ≥ 1% of price), the offer needs to be $74k (12.4% below list).
- It's been on market 258 days — a 12% lower offer ($75k) is reasonable based on typical stale-listing flexibility.
- Recommended offer: $74k (12.4% below list) — sets the bar for 1% rule.
- Local home prices are declining (-3.0%/yr); year-one equity from $588 of loan paydown is wiped out by about $3k of value loss. Plan a longer hold.
- Location reads 78/100 on livability (#158 in OH, #2,388 nationally) — a middle-class / working-renter tenant base. Strengths: cost of living A+, housing A+, health & safety A+; Watch: employment D, amenities F, commute F.
- Bucyrus City (town): math 37% / reading 46% proficiency, ranked #537 of 656 in OH (top 82%) — families likely to look elsewhere, expect single-tenant / working-renter base with shorter leases.
- Market conditions: 81 active listings in the ZIP; 1 comparable units currently listed for rent nearby; 8 units permitted in Crawford County in 2024 (0 in 5+ unit buildings).
- Crawford County population projected at -22% by 2050 — secular population decline; favor cash flow + early exit over multi-decade hold.
- 3 sale attempts since 2y ago; this cycle's ask has dropped $10k (11%) from the opening price — seller is motivated, your offer sets the floor, not the list.
- Cap rate 6.3% vs local median 4.4% in Bucyrus — top-decile yield for the area; either an underpriced asset or a hidden risk that comps aren't pricing in. Stress-test before assuming the spread holds.
- This rent is only 16% of the median local income ($57k/yr) — well below the 30% rent-burden line; pricing power to push rent on renewal without tenant pushback.
Questions for listing agent
- What do current leases actually rent for vs. the listed asking? Can we see a recent rent roll and the last 12 months of T-12 income?
- It's been on market 258 days. Have you received any prior offers? Is the seller open to a 12% concession, seller financing, or rate buy-down credit?
- Why hasn't it sold? Are there any deal-killer items the seller is aware of (foundation, flood, title, zoning, code violations)?
- Is there a deadline driving the sale (1031 exchange, divorce, estate, relocation)? That informs how much negotiation room exists.
- The area grade is low — what's the realistic commute time and amenity access for the typical tenant pool here? Any planned neighborhood developments (good or bad) we should know about?
- What's the average days-on-market for RENTAL listings here right now (not sales)? A rising rental-DOM trend means longer vacancies and softer asking-rent achievability than the comps imply.
- What's the recent tenant-quality profile in this submarket — average credit score on applications, eviction rate, late-payment / NSF rate, and stable-employment percentage? A property-management company in the area should have these aggregated.
- How much new for-sale + rental construction is in the pipeline within 1–3 miles? Heavy new supply typically softens prices + rents 12–24 months out; constrained supply supports both.
CashFlowRE · CFR-J82F6HEDBXFPYF
· Data 1 week ago
cashflowre.app · 2026-05-29