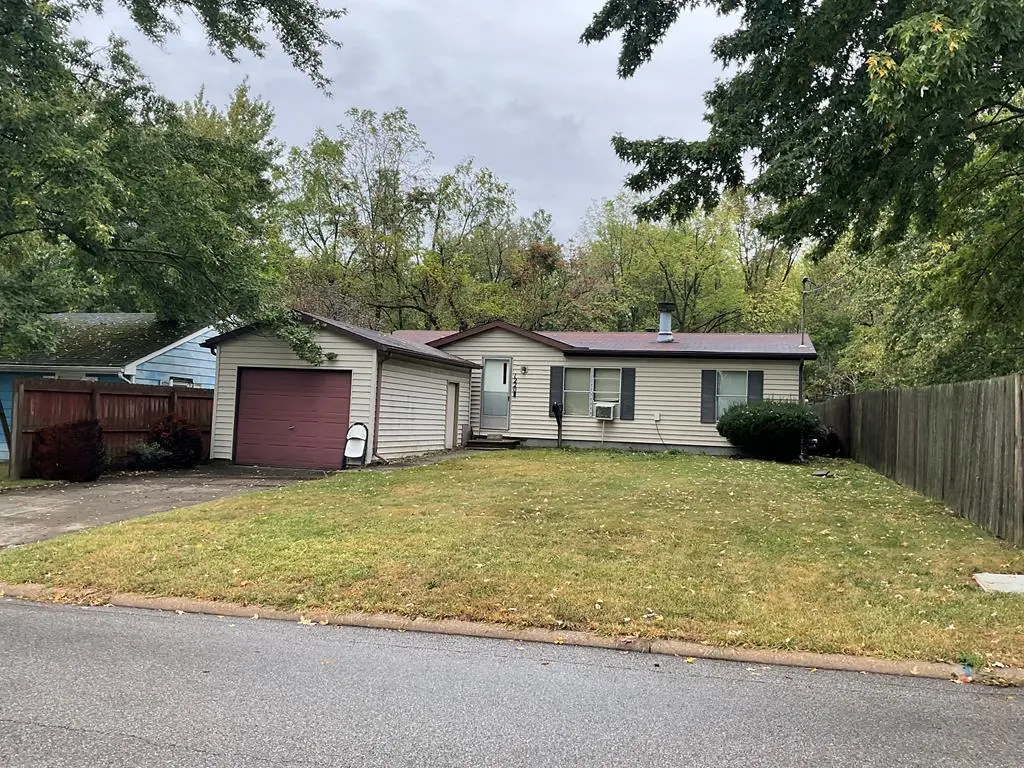
1220 E Warren St · Bucyrus, OH
Flood risk 1/10 · Minimal
- FEMA flood zone
- X (unshaded)
- Chance of flooding over 30 yrs
- 0.0%
- Est. flood insurance / yr
- $507 – $1,088
Fire risk 1/10 · Minimal
- Est. fire insurance / yr
- $713 – $1,323
Heat risk 3/10 · Minor
- Hot days now (above 98°F)
- 7 days/yr
- Hot days in 30 yrs
- 17 days/yr
Wind risk 2/10 · Minimal
- Chance of severe wind over 30 yrs
- —
Air-quality risk 2/10 · Minimal
- Unhealthy air days now
- 1 days/yr
- Unhealthy air days in 30 yrs
- 2 days/yr
Risk factors via First Street. Map © Google.
Why this score? — see what drove the D+ grade
The composite is a weighted blend of 9 inputs, each scored 0–100. Each bar is that input's sub-score; the figure is the points it added to the 100-point composite (weight × sub-score).
- ARV discount +15.0/15.0
- Cash flow +13.1/30.0
- DSCR +3.9/10.0
- Livability +3.9/5.0
- 1% rule +3.8/10.0
- Schools +3.4/10.0
- Rent growth +2.5/5.0
- Condition / age +2.5/5.0
- Appreciation +0.0/10.0
$85,000
🖨 Deal sheet 📄 Offer letter ✓ Due diligence
Listing remarks MLS
This cozy 3 bedroom, 2 bath ranch is perfect for downsizing. Features a fenced in back yard for your pets or just relaxing in privacy. Additional garage behind fence in back for extra storage. Make an appointment to see it today!
Key facts
- Fenced in back yard
- Garage
- Built 1988
Tags
Neighborhood map
What this means for you Summary
Snapshot
- This is a 2-bed/1.0-bath single-family listed at $85k.
Deal economics
- At list price, monthly cash flow is $-3 ($-34/yr) — negative.
- To cash-flow at today's rent, offer at most $85k (0.6% below list).
- To meet the 1% rule (rent ≥ 1% of price), the offer needs to be $74k (12.4% below list).
- Recommended offer: $74k (12.4% below list) — sets the bar for 1% rule.
- Cap rate 6.3% vs local median 4.4% in Bucyrus — top-decile yield for the area; either an underpriced asset or a hidden risk that comps aren't pricing in. Stress-test before assuming the spread holds.
Location & tenants
- Location reads 78/100 on livability (#158 in OH, #2,388 nationally) — a middle-class / working-renter tenant base. Strengths: cost of living A+, housing A+, health & safety A+; Watch: employment D, amenities F, commute F.
- Bucyrus City (town): math 37% / reading 46% proficiency, ranked #537 of 656 in OH (top 82%) — families likely to look elsewhere, expect single-tenant / working-renter base with shorter leases.
- Market conditions: 81 active listings in the ZIP; 1 comparable units currently listed for rent nearby; 8 units permitted in Crawford County in 2024 (0 in 5+ unit buildings).
- This rent is only 16% of the median local income ($57k/yr) — well below the 30% rent-burden line; pricing power to push rent on renewal without tenant pushback.
Forward outlook
- Local home prices are declining (-3.0%/yr); year-one equity from $588 of loan paydown is wiped out by about $3k of value loss. Plan a longer hold.
- Crawford County population projected at -22% by 2050 — secular population decline; favor cash flow + early exit over multi-decade hold.
Negotiation context
- It's been on market 258 days — a 12% lower offer ($75k) is reasonable based on typical stale-listing flexibility.
- 3 sale attempts since 2y ago; this cycle's ask has dropped $10k (11%) from the opening price — seller is motivated, your offer sets the floor, not the list.
Questions for the listing agent
- What do current leases actually rent for vs. the listed asking? Can we see a recent rent roll and the last 12 months of T-12 income?
- It's been on market 258 days. Have you received any prior offers? Is the seller open to a 12% concession, seller financing, or rate buy-down credit?
- Why hasn't it sold? Are there any deal-killer items the seller is aware of (foundation, flood, title, zoning, code violations)?
- Is there a deadline driving the sale (1031 exchange, divorce, estate, relocation)? That informs how much negotiation room exists.
- The area grade is low — what's the realistic commute time and amenity access for the typical tenant pool here? Any planned neighborhood developments (good or bad) we should know about?
- What's the average days-on-market for RENTAL listings here right now (not sales)? A rising rental-DOM trend means longer vacancies and softer asking-rent achievability than the comps imply.
- What's the recent tenant-quality profile in this submarket — average credit score on applications, eviction rate, late-payment / NSF rate, and stable-employment percentage? A property-management company in the area should have these aggregated.
- How much new for-sale + rental construction is in the pipeline within 1–3 miles? Heavy new supply typically softens prices + rents 12–24 months out; constrained supply supports both.
Investment metrics
- 1% rule
- 0.88% ✗
- Cap rate
- 6.25%
- Cash-on-cash
- -0.14%
- DSCR
- 0.99
- GRM
- 9.5
CMA / ARV
- ARV (median comp)
- $117,384
- List price
- $85,000
- Delta
- -27.59%
- Verdict
- UNDERPRICED
- Comps
- 20 within 1.0 mi
Show comp detail 10 sales within ~0.75 mi
| Address | Dist | Beds/Ba | Sqft | Sold | Price | $/sf | Match |
|---|---|---|---|---|---|---|---|
| 256 Hayes Ave | 0.14mi | 3/1.0 (+1) | 936 (-2%) | 14mo | $130,000 | $139 | 73 |
| 1211 Reid St | 0.19mi | 3/1.0 (+1) | 1,080 (+12%) | 14mo | $91,000 | $84 | 54 |
| 1320 E Southern Ave | 0.62mi | 2/2.0 | 896 (-7%) | 5mo | $200,000 | $223 | 52 |
| 1140 Whetstone St | 0.72mi | 3/1.5 (+1) | 923 (-4%) | 3mo | $96,500 | $105 | 51 |
| 210 Wiley St | 0.43mi | 2/1.0 | 1,064 (+11%) | 15mo | $77,500 | $73 | 49 |
| 1140 Hopley Ave | 0.71mi | 2/1.0 | 948 (-1%) | 19mo | $124,000 | $131 | 49 |
| 215 E Charles St | 0.71mi | 2/1.0 | 1,008 (+5%) | 14mo | $82,000 | $81 | 47 |
| 1402 Cullen Ave | 0.68mi | 3/1.0 (+1) | 1,040 (+8%) | 7mo | $155,000 | $149 | 44 |
| 560 Park Ave | 0.56mi | 3/1.0 (+1) | 1,040 (+8%) | 18mo | $98,500 | $95 | 40 |
| 1125 Jefferson | 0.74mi | 2/1.5 | 864 (-10%) | 19mo | $139,170 | $161 | 31 |
Match score weights: distance 35% · size 25% · config 20% · recency 20%. Top-matched comps best support the ARV.
Projected returns pro-forma
-3.0% appreciation · 3.0% rent growth · sell at horizon
- IRR
- -16.5%
- Equity multiple
- 0.41×
- Total profit
- $-13,939
- Equity at exit
- $12,674
- IRR
- -8.3%
- Equity multiple
- 0.48×
- Total profit
- $-12,312
- Equity at exit
- $7,349
Cash invested: $23,800 (down + closing). Projections, not guarantees.
Landlord ↔ Tenant lean methodology
- Overall (STATE)
- 73 Landlord-Friendly
- State Ohio
- 73 Landlord-Friendly · R+6
- County
- — inherits STATE
- City
- — inherits STATE
ZIP-level market 44820
- Home prices YoY
- -27.1%
- Active inventory
- 81
- Price-to-rent
- 9.5×
Monthly cashflow live
- Estimated rent
- $745 medium interval (Pro) →
- Mortgage (P&I)
- −$446
- Tax from tax record
- −$110 /mo · $1,322/yr
- Insurance
- −$35
- HOA
- −$0
- Vacancy / Maint / Mgmt
- −$156
- Net cashflow
- $-3
Break-even live
UW: 25.0% down · 7.5% · 30yr · 1.5% tax · 5.0% vac · 8.0% maint · 8.0% mgmt
Financing live
Cash to close
- Down payment
- $21,250
- Closing costs
- $2,550
- Reserves months
- —
- Total cash needed
- —
Loan-product check · same deal, 3 products live
Conventional
25% down · 7.5% · 30yr
- Down + closing
- —
- Monthly P&I
- —
- Monthly cashflow
- —
- DSCR
- —
- Eligible?
- —
Personal DTI + credit; lowest rate.
DSCR
20% down · 8.5% · 30yr
- Down + closing
- —
- Monthly P&I
- —
- Monthly cashflow
- —
- DSCR
- —
- Eligible?
- —
No personal income docs; deal must DSCR.
Hard money
10% down · 12.0% · 12mo
- Down + closing
- —
- Monthly P&I
- —
- Monthly cashflow
- —
- DSCR
- —
- Eligible?
- —
Short-term bridge; refi at stabilization.
Rent comps 1 comps
| Address | Beds | Baths | Sqft | Rent | $/sqft | DOM | Units | Dist |
|---|---|---|---|---|---|---|---|---|
| 738 W Charles St Unit 738 Bucyrus, OH | 1.0 | 1.0 | 700 | $745 | $1.06 | 43d | 1 | 1.32mi |
Listing history 16 events
-
2026-06-08days on market $85,000 Active 258 DOM
-
2026-06-07days on market $85,000 Active 257 DOM
-
2026-06-05days on market $85,000 Active 255 DOM
-
2026-06-04days on market $85,000 Active 253 DOM
-
2026-06-02days on market $85,000 Active 252 DOM
-
2026-06-01days on market $85,000 Active 251 DOM
-
2026-05-31days on market $85,000 Active 250 DOM
-
2026-05-04price $85,000 229-char remark
Show marketing remark (229 chars)
This cozy 3 bedroom, 2 bath ranch is perfect for downsizing. Features a fenced in back yard for your pets or just relaxing in privacy. Additional garage behind fence in back for extra storage. Make an appointment to see it today!
-
2026-04-08price $89,900 229-char remark
Show marketing remark (229 chars)
This cozy 3 bedroom, 2 bath ranch is perfect for downsizing. Features a fenced in back yard for your pets or just relaxing in privacy. Additional garage behind fence in back for extra storage. Make an appointment to see it today!
-
2025-11-17status Active 229-char remark
Show marketing remark (229 chars)
This cozy 3 bedroom, 2 bath ranch is perfect for downsizing. Features a fenced in back yard for your pets or just relaxing in privacy. Additional garage behind fence in back for extra storage. Make an appointment to see it today!
-
2025-10-13historical Active Under Contract 229-char remark
Show marketing remark (229 chars)
This cozy 3 bedroom, 2 bath ranch is perfect for downsizing. Features a fenced in back yard for your pets or just relaxing in privacy. Additional garage behind fence in back for extra storage. Make an appointment to see it today!
-
2025-09-23$95,000 Active 229-char remark
Show marketing remark (229 chars)
This cozy 3 bedroom, 2 bath ranch is perfect for downsizing. Features a fenced in back yard for your pets or just relaxing in privacy. Additional garage behind fence in back for extra storage. Make an appointment to see it today!
-
2024-12-16soldstatus $85,000
-
2024-12-12soldstatus $84,000 Closed 358-char remark
Show marketing remark (358 chars)
This clean and cozy 3 bedroom, 2 bath ranch is move in ready. Key features include primary bedroom w/ full bath and walk-in closet, eat-in kitchen, living room with breakfast bar and fireplace. The one car and 1.5 car detached garages provide plenty of storage and the privacy fenced back yard offer a great space of gardening, pets or enjoying the outdoors.
-
2024-11-12historical Active Under Contract 358-char remark
Show marketing remark (358 chars)
This clean and cozy 3 bedroom, 2 bath ranch is move in ready. Key features include primary bedroom w/ full bath and walk-in closet, eat-in kitchen, living room with breakfast bar and fireplace. The one car and 1.5 car detached garages provide plenty of storage and the privacy fenced back yard offer a great space of gardening, pets or enjoying the outdoors.
-
2024-10-25$95,000 Active 358-char remark
Show marketing remark (358 chars)
This clean and cozy 3 bedroom, 2 bath ranch is move in ready. Key features include primary bedroom w/ full bath and walk-in closet, eat-in kitchen, living room with breakfast bar and fireplace. The one car and 1.5 car detached garages provide plenty of storage and the privacy fenced back yard offer a great space of gardening, pets or enjoying the outdoors.
ⓘ Source: listings_history table (triggers on properties + properties_extension) + one-shot
backfill from property_details.listing_events for pre-trigger history.
Tax reassessment forecast OH · Partial reset (capped growth)
- Current annual tax
- $1,322 · $110/mo
- Projected year-2 tax
- $1,324 · $110/mo
- Expected delta
- +$2/yr ($0/mo · 0.1%)
ⓘ Screening estimate from a state-policy table — verify with the county assessor before closing.
Climate risk First Street
- Flood 1/10 Low FEMA zone X (unshaded) · 0% chance over 30 yrs
- Wildfire 1/10 Low
- Heat 3/10 Moderate 7 d/yr ≥98°F today · 17 d/yr by 30 yrs out
- Wind 2/10 Low
- Air quality 2/10 Low 1 unhealthy d/yr today · 2 by 30 yrs out
Nearby sold comps map
Loading sold comps map…
Walkable amenities ~0.75 mi
Loading nearby amenities…
Taxation est. · year 1
- Rental income
- $8,940
- − Mortgage interest
- −$4,761
- − Property taxes
- −$1,322
- − Insurance
- −$425
- − Repairs & maintenance
- −$715
- − Management
- −$715
- − Depreciation
- −$2,473
- Taxable loss
- −$1,472
- Est. tax savings @ 24.0%
- +$353
- After-tax cash flow
- $320/yr
For passive investors: Depreciation is non-cash, so a rental often shows a tax loss while cash-flowing — sheltering income. Rental losses are passive: they offset passive income freely, and up to $25,000/yr can offset ordinary (W-2) income if you actively participate and your MAGI is under $100k (phasing out to $0 by $150k); unused losses carry forward. On sale, claimed depreciation is recaptured at up to 25%, and gains may owe capital-gains tax (a 1031 exchange can defer both). Figures are a year-1 estimate at your 24.0% rate — not tax advice; consult a CPA.
Schools (NCES district)
- District
- Bucyrus City
- NCES district ID
- 3904368
- Math proficiency
- 37% ▼ -15.00%
- Reading proficiency
- 46% ▼ -5.00%
- Median HH income
- $36,819
- Composite
- 34.45/100
- National rank
- #5196
- State rank
- #537 of 656 in OH
Livability — Bucyrus
- Score
- 78/100
- State rank
- #158
- US rank
- #2388
Category grades
Schools grade is shown separately in the Schools card above.
Census & demographics
- Census place
- Bucyrus, OH
- County
- Crawford · 26,873 people
- City population
- 17,265
- Population (ZIP)
- 17,265
- Household income
- $56,942
- Rent vs Own
- Severe rent burden
- 8.2
Population outlook (Crawford County) Hauer SSP2
- Today (2025)
- 39,421 people
- By 2030
- 37,656 · -4.5%
- By 2040
- 34,043 · -13.6%
- By 2050
- 30,617 · -22.3%
- By 2075
- 23,652 · -40.0%
- By 2100
- 17,786 · -54.9%
Race, ethnicity, and origin ACS 2023
- Neighborhood character
- Predominantly White (93%)
- Race & ethnicity
- White 93% Two or more races 3% Hispanic / Latino 2% Asian 1% Black 1%
- Common ancestry
- Iranian 2% Lithuanian 2% Slovak 1%
- Foreign-born
- 1%
- Languages at home
- 97% English-only · Other Asian/Pacific 1% Spanish 1%
Political lean MEDSL · Crawford
- 2024 margin
- Solid R (+53.0) · D 23.1% · R 76.1%
- 2008→2024 swing
- -33.9pp toward R · 2008: -19.0pp · 2024: -53.0pp
- All cycles
- 2024: R+53.0 2020: R+50.9 2016: R+46.8 2012: R+22.7 2008: R+19.0
Not yet ingested
- Civics
- —
Market trends
- HPI YoY
- ▼ -65.64%
- Current HPI
- 176.3548
- Rent YoY
- —
- Metro
- —
- State GDP YoY
- ▲ 1.98%
- F500 in state
- 48
Industry mix (Fortune 500 HQ in OH)
| Industry | F500 HQs | Revenue |
|---|---|---|
| Insurance | 3 | $145B |
|
||
| Industrial Machinery | 3 | $49B |
|
||
| Financial Services | 3 | $24B |
|
||
| Consumer Goods | 2 | $93B |
|
||
| Aerospace / Defense | 2 | $47B |
|
||
| Utilities | 2 | $33B |
|
||
Price history
-10.5% since first listed9 events — show timeline
- 2026-05-04 Price Changed $85,000 MARMLS
- 2026-04-08 Price Changed $89,900 MARMLS
- 2025-11-17 Relisted — MARMLS
- 2025-10-13 Contingent — MARMLS
- 2025-09-23 Listed $95,000 MARMLS
- 2024-12-16 Sold (Public Records) $85,000 Public Records
- 2024-12-12 Sold (MLS) $84,000 MARMLS
- 2024-11-12 Contingent — MARMLS
- 2024-10-25 Listed $95,000 MARMLS
Property tax history
+2.9%/yrLatest (2025): $1,322 · +51.0% YoY. Source: county tax records.
Cash-flow waterfall
monthlySold comps — $/sqft
last 12 mo · ≤1 miLoading sold comps…