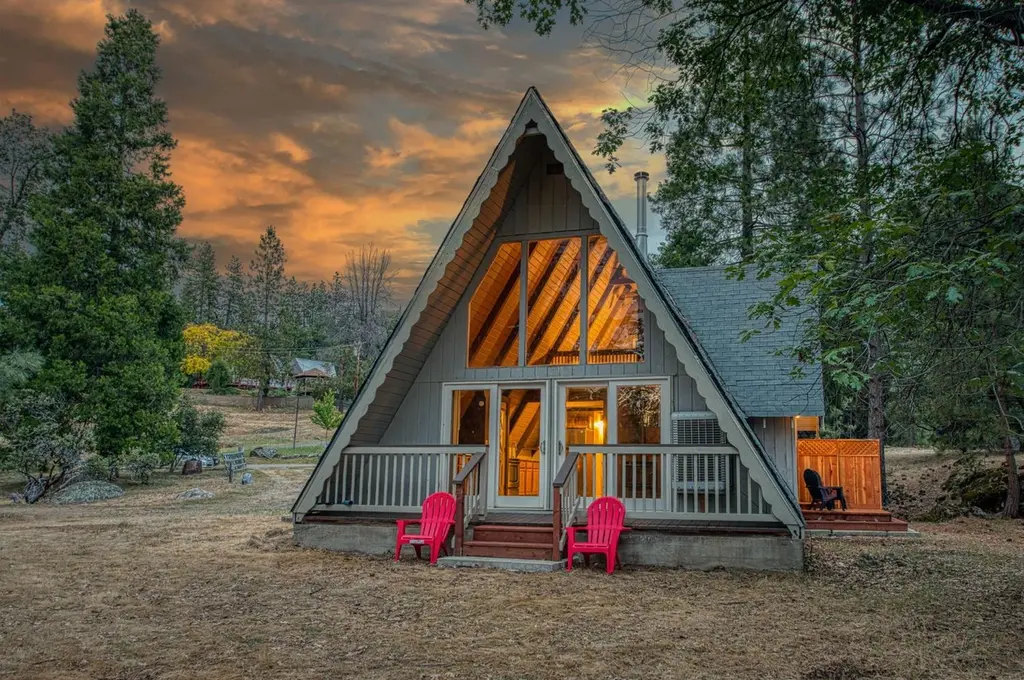
5975 Evergreen Ln
Bootjack, CA 95338
$249,000B-
1 bd · 1.0 ba ·
1,090 sqft ·
Built 1963
· SingleFamily
· Active
· 23 DOM
Cashflow @ list (25.0% down · 7.5%)
Estimated rent
$3,500/mo
Mortgage (P&I)
−$1,306
Tax + insurance
−$162
HOA
−$15
Vac / Maint / Mgmt
−$735
Net cashflow
$1,282/mo
Annual
$15,382/yr
Cap rate
12.47%
Cash-on-cash
22.06%
DSCR
1.98
1% rule
1.41%
Cash to close
$69,720
Investor read
- This is a 1-bed/1.0-bath single-family listed at $249k.
- At list price, monthly cash flow is $1k ($15k/yr) — positive.
- The deal already cash-flows at list — no discount required.
- Meets the 1% rule at list price ($4k rent vs $249k).
- It's been on market 23 days — a 2% lower offer ($245k) is reasonable based on typical stale-listing flexibility.
- Recommended offer: $245k (1.5% below list) — sets the bar for market timing.
- Local home prices are declining (-3.0%/yr); year-one equity from $2k of loan paydown is wiped out by about $7k of value loss. Plan a longer hold.
- Location reads 48/100 on livability (#1,203 in CA) — a working-class tenant base; expect higher turnover. Strengths: housing B; Watch: employment C-, crime F, amenities F.
- Mariposa County Unified (rural): math 27% / reading 42% proficiency, ranked #282 of 517 in CA (top 54%) — families likely to look elsewhere, expect single-tenant / working-renter base with shorter leases.
- Zoned schools: Woodland Elementary (math 25% / reading 42%, grade F, #764 of 1,571 statewide, top 49%, 423 students, 62% FRL); Mariposa County High (math 47% / reading 57%, grade D+, #296 of 1,170 statewide, top 27%, 448 students, 61% FRL).
- Market conditions: 170 active listings in the ZIP; 1 comparable units currently listed for rent nearby; 89 units permitted in Mariposa County in 2024 (0 in 5+ unit buildings).
- Mariposa County population projected at -23% by 2050 — secular population decline; favor cash flow + early exit over multi-decade hold.
- 2 sale attempts since 14y ago with the ask held roughly flat each time — persistent listings suggest the price (not the market) is what's stuck; bring a comps-based counter.
- Current owner paid $55k; list at $249k implies a 353% gain — meaningful room to come down on a strong offer.
- At projected returns (-3.0% appreciation + 3.0% rent growth), your $70k cash investment doubles in ~6 years — after that, you're playing with house money.
- Climate carrying-cost: severe wildfire risk — expect insurance premiums to compound above CPI over the hold.
- Cap rate 12.5% vs local median 3.3% in Bootjack — top-decile yield for the area; either an underpriced asset or a hidden risk that comps aren't pricing in. Stress-test before assuming the spread holds.
Questions for listing agent
- Built in 1963 — when were the roof, HVAC, electrical panel, plumbing, and water heater last replaced?
- What does the HOA fee cover, when was the last increase, and are there any pending special assessments or reserve-fund shortfalls?
- Is there a deadline driving the sale (1031 exchange, divorce, estate, relocation)? That informs how much negotiation room exists.
- Crime grade is F in this area — have there been break-ins, vandalism, or insurance claims at this property in the last 3 years? What carrier currently insures it and at what premium?
- What's the average days-on-market for RENTAL listings here right now (not sales)? A rising rental-DOM trend means longer vacancies and softer asking-rent achievability than the comps imply.
- What's the recent tenant-quality profile in this submarket — average credit score on applications, eviction rate, late-payment / NSF rate, and stable-employment percentage? A property-management company in the area should have these aggregated.
- How much new for-sale + rental construction is in the pipeline within 1–3 miles? Heavy new supply typically softens prices + rents 12–24 months out; constrained supply supports both.
CashFlowRE · CFR-J8K43X8XQNN47N
· Data 16 h ago
cashflowre.app · 2026-05-29