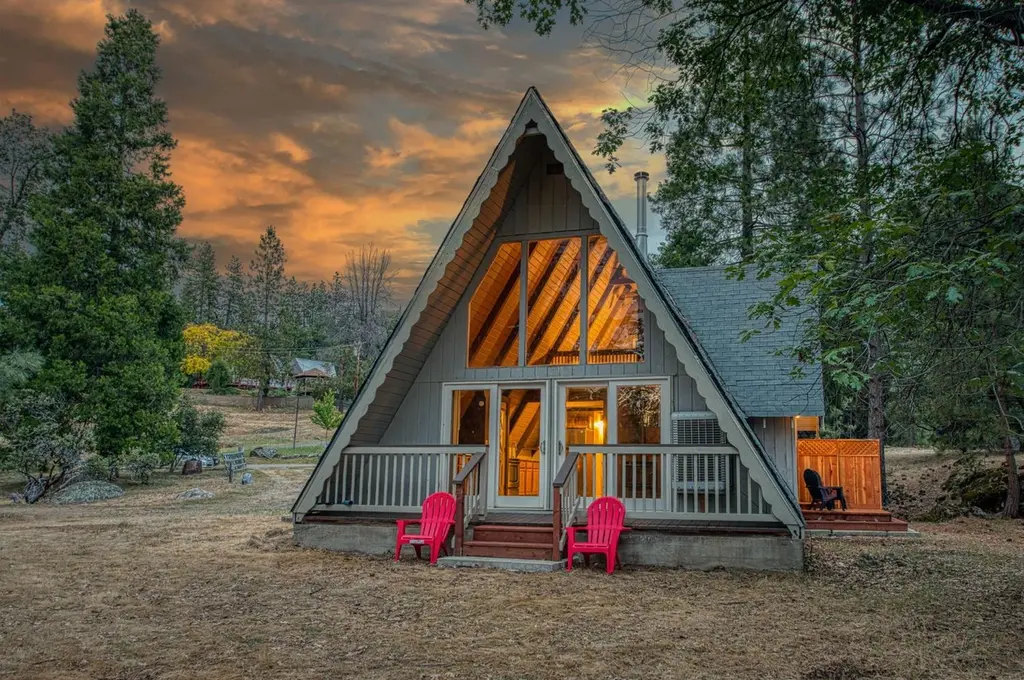
5975 Evergreen Ln · Bootjack, CA
Flood risk 1/10 · Minimal
- FEMA flood zone
- X (unshaded)
- Chance of flooding over 30 yrs
- 0.0%
- Est. flood insurance / yr
- $507 – $1,088
Fire risk 8/10 · Major
- Est. fire insurance / yr
- $659 – $1,223
Heat risk 4/10 · Minor
- Hot days now (above 99°F)
- 9 days/yr
- Hot days in 30 yrs
- 23 days/yr
Wind risk 1/10 · Minimal
- Chance of severe wind over 30 yrs
- —
Air-quality risk 10/10 · Severe
- Unhealthy air days now
- 48 days/yr
- Unhealthy air days in 30 yrs
- 55 days/yr
Risk factors via First Street. Map © Google.
Why this score? — see what drove the B- grade
The composite is a weighted blend of 9 inputs, each scored 0–100. Each bar is that input's sub-score; the figure is the points it added to the 100-point composite (weight × sub-score).
- Cash flow +30.0/30.0
- DSCR +10.0/10.0
- 1% rule +9.1/10.0
- ARV discount +7.5/15.0
- Schools +3.0/10.0
- Rent growth +2.5/5.0
- Condition / age +2.5/5.0
- Livability +2.4/5.0
- Appreciation +0.0/10.0
$249,000
🖨 Deal sheet (PDF) 📄 Offer letter ✓ Due diligence
Listing remarks MLS
HUD HOME, This property features a one bedroom and bathroom and this property has a bedroom in the attic.
Key facts
- Thoughtful updates
- Vaulted ceilings
- Granite countertops
Tags
Property features AI
Finance
- Other: Living area per public records
- HOA & community: Has association; Annual association fee of $180; Community clubhouse, lake/pond, and playground
Exterior
- Parking: Open parking; Potential RV parking
- Utilities: Electricity connected; Electric service on; Septic tank
- Home design: Two-story single family residence; Composition roof; Wood siding exterior; Concrete foundation
- Construction: Wood siding construction; Composition roof; Concrete foundation
- Exterior features: Deck; Foothill setting; Pasture surroundings
Interior
- Kitchen: F/S Range/Oven; Electric appliances
- Flooring: Laminate
- Bathrooms: 1 bathroom with a shower
- Heating & cooling: Floor or wall heating unit; Evaporative cooling
- Interior features: Loft; Free-standing fireplace
- Laundry & utility: Laundry inside
Neighborhood map
What this means for you Summary
Snapshot
- This is a 1-bed/1.0-bath single-family listed at $249k.
Deal economics
- At list price, monthly cash flow is $1k ($15k/yr) — positive.
- The deal already cash-flows at list — no discount required.
- Meets the 1% rule at list price ($4k rent vs $249k).
- Recommended offer: $245k (1.5% below list) — sets the bar for market timing.
- Cap rate 12.5% vs local median 3.3% in Bootjack — top-decile yield for the area; either an underpriced asset or a hidden risk that comps aren't pricing in. Stress-test before assuming the spread holds.
Location & tenants
- Location reads 48/100 on livability (#1,203 in CA) — a working-class tenant base; expect higher turnover. Strengths: housing B; Watch: employment C-, crime F, amenities F.
- Mariposa County Unified (rural): math 27% / reading 42% proficiency, ranked #282 of 517 in CA (top 54%) — families likely to look elsewhere, expect single-tenant / working-renter base with shorter leases.
- Zoned schools: Woodland Elementary (math 25% / reading 42%, grade F, #764 of 1,571 statewide, top 49%, 423 students, 62% FRL); Mariposa County High (math 47% / reading 57%, grade D+, #296 of 1,170 statewide, top 27%, 448 students, 61% FRL).
- Market conditions: 170 active listings in the ZIP; 1 comparable units currently listed for rent nearby; 89 units permitted in Mariposa County in 2024 (0 in 5+ unit buildings).
Forward outlook
- Local home prices are declining (-3.0%/yr); year-one equity from $2k of loan paydown is wiped out by about $7k of value loss. Plan a longer hold.
- Mariposa County population projected at -23% by 2050 — secular population decline; favor cash flow + early exit over multi-decade hold.
- At projected returns (-3.0% appreciation + 3.0% rent growth), your $70k cash investment doubles in ~6 years — after that, you're playing with house money.
Negotiation context
- It's been on market 23 days — a 2% lower offer ($245k) is reasonable based on typical stale-listing flexibility.
- 2 sale attempts since 14y ago with the ask held roughly flat each time — persistent listings suggest the price (not the market) is what's stuck; bring a comps-based counter.
- Current owner paid $55k; list at $249k implies a 353% gain — meaningful room to come down on a strong offer.
Risks & watch-outs
- Climate carrying-cost: severe wildfire risk — expect insurance premiums to compound above CPI over the hold.
Questions for the listing agent
- Built in 1963 — when were the roof, HVAC, electrical panel, plumbing, and water heater last replaced?
- What does the HOA fee cover, when was the last increase, and are there any pending special assessments or reserve-fund shortfalls?
- Is there a deadline driving the sale (1031 exchange, divorce, estate, relocation)? That informs how much negotiation room exists.
- Crime grade is F in this area — have there been break-ins, vandalism, or insurance claims at this property in the last 3 years? What carrier currently insures it and at what premium?
- What's the average days-on-market for RENTAL listings here right now (not sales)? A rising rental-DOM trend means longer vacancies and softer asking-rent achievability than the comps imply.
- What's the recent tenant-quality profile in this submarket — average credit score on applications, eviction rate, late-payment / NSF rate, and stable-employment percentage? A property-management company in the area should have these aggregated.
- How much new for-sale + rental construction is in the pipeline within 1–3 miles? Heavy new supply typically softens prices + rents 12–24 months out; constrained supply supports both.
Investment metrics
- 1% rule
- 1.41% ✓
- Cap rate
- 12.47%
- Cash-on-cash
- 22.06%
- DSCR
- 1.98
- GRM
- 5.9
CMA / ARV
No comps found within radius.
Projected returns pro-forma
-3.0% appreciation · 3.0% rent growth · sell at horizon
- IRR
- 14.8%
- Equity multiple
- 1.59×
- Total profit
- $41,198
- Equity at exit
- $37,127
- IRR
- 23.5%
- Equity multiple
- 3.02×
- Total profit
- $140,620
- Equity at exit
- $21,529
Cash invested: $69,720 (down + closing). Projections, not guarantees.
Landlord ↔ Tenant lean methodology
- Overall (STATE)
- 18 Strongly Tenant-Friendly
- State California
- 18 Strongly Tenant-Friendly · D+13
- County
- — inherits STATE
- City
- — inherits STATE
ZIP-level market 95338
- Active inventory
- 170
- Price-to-rent
- 5.9×
Monthly cashflow live
- Estimated rent
- $3,500 medium interval (Pro) →
- Mortgage (P&I)
- −$1,306
- Tax from tax record
- −$59 /mo · $704/yr
- Insurance
- −$104
- HOA
- −$15
- Vacancy / Maint / Mgmt
- −$735
- Net cashflow
- $1,282
Break-even live
Sensitivity live
| Price | -10% $1,423 | -5% $1,352 | +0% $1,282 | +5% $1,211 | +10% $1,141 |
|---|---|---|---|---|---|
| Rent | -10% $1,005 | -5% $1,144 | +0% $1,282 | +5% $1,420 | +10% $1,558 |
| Rate | -1.0pp $1,407 | -0.5pp $1,345 | base $1,282 | +0.5pp $1,217 | +1.0pp $1,152 |
UW: 25.0% down · 7.5% · 30yr · 1.5% tax · 5.0% vac · 8.0% maint · 8.0% mgmt
Financing live
Cash to close
- Down payment
- $62,250
- Closing costs
- $7,470
- Reserves months
- —
- Total cash needed
- —
Loan-product check · same deal, 3 products live
Conventional
25% down · 7.5% · 30yr
- Down + closing
- —
- Monthly P&I
- —
- Monthly cashflow
- —
- DSCR
- —
- Eligible?
- —
Personal DTI + credit; lowest rate.
DSCR
20% down · 8.5% · 30yr
- Down + closing
- —
- Monthly P&I
- —
- Monthly cashflow
- —
- DSCR
- —
- Eligible?
- —
No personal income docs; deal must DSCR.
Hard money
10% down · 12.0% · 12mo
- Down + closing
- —
- Monthly P&I
- —
- Monthly cashflow
- —
- DSCR
- —
- Eligible?
- —
Short-term bridge; refi at stabilization.
Rent comps 1 comps
| Address | Beds | Baths | Sqft | Rent | $/sqft | DOM | Units | Dist |
|---|---|---|---|---|---|---|---|---|
| 6106 Smither Rd Mariposa, CA | 2.0 | 2.0 | 1474 | $3,500 | $2.37 | 45d | 1 | 0.97mi |
HOA detail
- Monthly dues
- $15 · $180/yr
Listing history 21 events
-
2026-06-21days on market $249,000 Active 23 DOM
-
2026-06-19days on market $249,000 Active 21 DOM
-
2026-06-18days on market $249,000 Active 20 DOM
-
2026-06-17days on market $249,000 Active 19 DOM
-
2026-06-17$249,000 Active 18 DOM
-
2026-06-16days on market $249,000 Active 18 DOM
-
2026-06-15days on market $249,000 Active 17 DOM
-
2026-06-14days on market $249,000 Active 15 DOM
-
2026-06-13days on market $249,000 Active 14 DOM
-
2026-06-10days on market $249,000 Active 12 DOM
-
2026-06-09days on market $249,000 Active 11 DOM
-
2026-06-08days on market $249,000 Active 10 DOM
-
2026-06-07days on market $249,000 Active 9 DOM
-
2026-06-05days on market $249,000 Active 6 DOM
-
2026-06-03days on market $249,000 Active 5 DOM
-
2026-06-02days on market $249,000 Active 4 DOM
-
2026-06-01days on market $249,000 Active 3 DOM
-
2026-05-31days on market $249,000 Active 2 DOM
-
2026-05-22$249,000 Active
-
2012-12-20soldstatus $55,000 105-char remark
Show marketing remark (105 chars)
HUD HOME, This property features a one bedroom and bathroom and this property has a bedroom in the attic.
-
2012-10-26$65,000 105-char remark
Show marketing remark (105 chars)
HUD HOME, This property features a one bedroom and bathroom and this property has a bedroom in the attic.
ⓘ Source: listings_history table (triggers on properties + properties_extension) + one-shot
backfill from property_details.listing_events for pre-trigger history.
Tax reassessment forecast CA · Resets to sale price
- Current annual tax
- $704 · $59/mo
- Projected year-2 tax
- $1,892 · $158/mo
- Expected delta
- +$1,189/yr (+$99/mo · 168.9%)
ⓘ Screening estimate from a state-policy table — verify with the county assessor before closing.
Climate risk First Street
- Flood 1/10 Low FEMA zone X (unshaded) · 0% chance over 30 yrs
- Wildfire 8/10 Severe
- Heat 4/10 Moderate 9 d/yr ≥99°F today · 23 d/yr by 30 yrs out
- Wind 1/10 Low
- Air quality 10/10 Extreme 48 unhealthy d/yr today · 55 by 30 yrs out
Nearby sold comps map
Loading sold comps map…
Walkable amenities ~0.75 mi
Loading nearby amenities…
Taxation est. · year 1
- Rental income
- $42,000
- − Mortgage interest
- −$13,948
- − Property taxes
- −$704
- − Insurance
- −$1,245
- − Repairs & maintenance
- −$3,360
- − Management
- −$3,360
- − HOA
- −$180
- − Depreciation
- −$7,244
- Taxable income
- $11,960
- Est. tax owed @ 24.0%
- −$2,870
- After-tax cash flow
- $12,512/yr
For passive investors: Depreciation is non-cash, so a rental often shows a tax loss while cash-flowing — sheltering income. Rental losses are passive: they offset passive income freely, and up to $25,000/yr can offset ordinary (W-2) income if you actively participate and your MAGI is under $100k (phasing out to $0 by $150k); unused losses carry forward. On sale, claimed depreciation is recaptured at up to 25%, and gains may owe capital-gains tax (a 1031 exchange can defer both). Figures are a year-1 estimate at your 24.0% rate — not tax advice; consult a CPA.
Schools (NCES district)
- District
- Mariposa County Unified
- NCES district ID
- 0623940
- Math proficiency
- 27% ▼ -12.00%
- Reading proficiency
- 42% ▼ -5.00%
- Median HH income
- $48,669
- Composite
- 29.75/100
- National rank
- #6438
- State rank
- #282 of 517 in CA
Livability — Bootjack
- Score
- 48/100
- State rank
- #1203
- US rank
- #26092
Category grades
Schools grade is shown separately in the Schools card above.
Census & demographics
- Population (ZIP)
- 10,164
Population outlook (Mariposa County) Hauer SSP2
- Today (2025)
- 15,956 people
- By 2030
- 15,078 · -5.5%
- By 2040
- 13,413 · -15.9%
- By 2050
- 12,232 · -23.3%
- By 2075
- 11,143 · -30.2%
- By 2100
- 10,187 · -36.2%
Race, ethnicity, and origin ACS 2023
- Neighborhood character
- Predominantly White (81%)
- Race & ethnicity
- White 81% Two or more races 9% Hispanic / Latino 9% Native American 2% Asian 2%
- Hispanic origin (detail)
- Mexican 7%
- Common ancestry
- Lithuanian 5% Italian 4% Russian 2%
- Foreign-born
- 4% · Canada, China
- Languages at home
- 95% English-only · Spanish 2% French/Haitian/Cajun 1% Chinese 1%
Political lean MEDSL · Mariposa
- 2024 margin
- Strong R (+21.1) · D 38.1% · R 59.1% · Other 2.8%
- 2008→2024 swing
- -8.6pp toward R · 2008: -12.4pp · 2024: -21.1pp
- All cycles
- 2024: R+21.1 2020: R+18.1 2016: R+23.2 2012: R+17.4 2008: R+12.4
Not yet ingested
- Civics
- —
Market trends
- HPI YoY
- ▼ -151.82%
- Current HPI
- 140.3045
- Rent YoY
- —
- Metro
- —
- State GDP YoY
- ▲ 3.21%
- F500 in state
- 116
Industry mix (Fortune 500 HQ in CA)
| Industry | F500 HQs | Revenue |
|---|---|---|
| Technology | 27 | $1,492B |
|
||
| Financial Services | 3 | $174B |
|
||
| Retail | 3 | $44B |
|
||
| Insurance | 3 | $26B |
|
||
| Media / Entertainment | 2 | $115B |
|
||
| Pharmaceuticals / Biotech | 2 | $62B |
|
||
Price history
+283.1% since first listed3 events — show timeline
- 2026-05-22 Listed $249,000 FRESNOMLS
- 2012-12-20 Sold (MLS) $55,000 CRMLS
- 2012-10-26 Listed $65,000 CRMLS
Property tax history
+1.0%/yrLatest (2025): $704 · +2.6% YoY. Source: county tax records.
Cash-flow waterfall
monthlySold comps — $/sqft
last 12 mo · ≤1 miLoading sold comps…