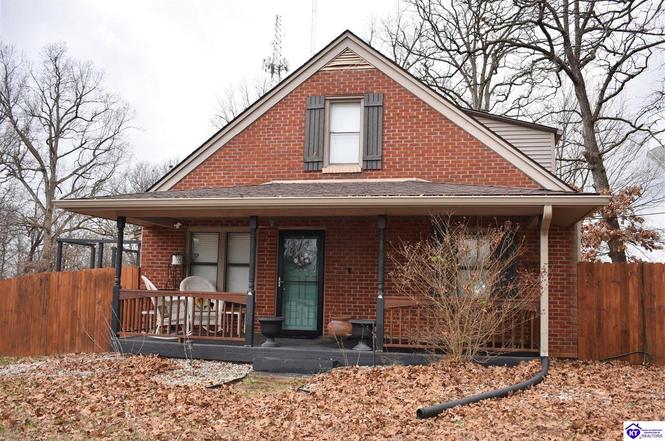
206 Pear Orchard Rd Rd NW
Elizabethtown, KY 42701
$210,000D-
3 bd · 1.0 ba ·
1,478 sqft ·
Built 1950
· SingleFamily
· Pending
· 94 DOM
Cashflow @ list (25.0% down · 7.5%)
Estimated rent
$1,619/mo
Mortgage (P&I)
−$1,101
Tax + insurance
−$242
HOA
−$0
Vac / Maint / Mgmt
−$340
Net cashflow
$-64/mo
Annual
$-773/yr
Cap rate
5.92%
Cash-on-cash
-1.32%
DSCR
0.94
1% rule
0.77%
Cash to close
$58,800
Investor read
- This is a 3-bed/1.0-bath single-family listed at $210k.
- At list price, monthly cash flow is $-64 ($-773/yr) — negative.
- To cash-flow at today's rent, offer at most $199k (5.4% below list).
- To meet the 1% rule (rent ≥ 1% of price), the offer needs to be $162k (22.9% below list).
- It's been on market 94 days — a 9% lower offer ($191k) is reasonable based on typical stale-listing flexibility.
- Recommended offer: $162k (22.9% below list) — sets the bar for 1% rule.
- Local home prices are declining (-3.0%/yr); year-one equity from $1k of loan paydown is wiped out by about $6k of value loss. Plan a longer hold.
- Location reads 72/100 on livability (#131 in KY) — a middle-class / working-renter tenant base. Strengths: crime A+, cost of living A+, housing A; Watch: employment D, amenities F, commute F.
- Hardin County (suburban): math 30% / reading 43% proficiency, ranked #47 of 165 in KY (top 28%) — families likely to look elsewhere, expect single-tenant / working-renter base with shorter leases.
- Zoned schools: New Highland Elementary School (math 22% / reading 27%, grade F, #489 of 676 statewide, top 76%, 501 students, 62% FRL); Bluegrass Middle School (math 22% / reading 40%, grade F, #138 of 217 statewide, top 65%, 578 students, 52% FRL); John Hardin High School (math 27% / reading 42%, grade F, #76 of 254 statewide, top 34%, 790 students, 52% FRL).
- Watch-outs: built in 1950 — expect roof / HVAC / electrical / plumbing capex.
- Market conditions: Rents rising (+3.3%/yr); 548 active listings in the ZIP; 1 comparable units currently listed for rent nearby; 946 units permitted in Hardin County in 2024 (464 in 5+ unit buildings).
- Hardin County population projected at -16% by 2050 — secular population decline; favor cash flow + early exit over multi-decade hold.
- 3 sale attempts since 8y ago; this cycle's ask has dropped $30k (12%) from the opening price — seller is motivated, your offer sets the floor, not the list.
- Current owner paid $135k; list at $210k implies a 56% gain — meaningful room to come down on a strong offer.
- Cap rate 5.9% vs local median 3.4% in Elizabethtown — top-decile yield for the area; either an underpriced asset or a hidden risk that comps aren't pricing in. Stress-test before assuming the spread holds.
Questions for listing agent
- What do current leases actually rent for vs. the listed asking? Can we see a recent rent roll and the last 12 months of T-12 income?
- It's been on market 94 days. Have you received any prior offers? Is the seller open to a 23% concession, seller financing, or rate buy-down credit?
- Built in 1950 — when were the roof, HVAC, electrical panel, plumbing, and water heater last replaced?
- Why hasn't it sold? Are there any deal-killer items the seller is aware of (foundation, flood, title, zoning, code violations)?
- Is there a deadline driving the sale (1031 exchange, divorce, estate, relocation)? That informs how much negotiation room exists.
- The area grade is low — what's the realistic commute time and amenity access for the typical tenant pool here? Any planned neighborhood developments (good or bad) we should know about?
- What's the average days-on-market for RENTAL listings here right now (not sales)? A rising rental-DOM trend means longer vacancies and softer asking-rent achievability than the comps imply.
- What's the recent tenant-quality profile in this submarket — average credit score on applications, eviction rate, late-payment / NSF rate, and stable-employment percentage? A property-management company in the area should have these aggregated.
CashFlowRE · CFR-J8YQJR2J32K3Z7
· Data 4 weeks ago
cashflowre.app · 2026-05-29