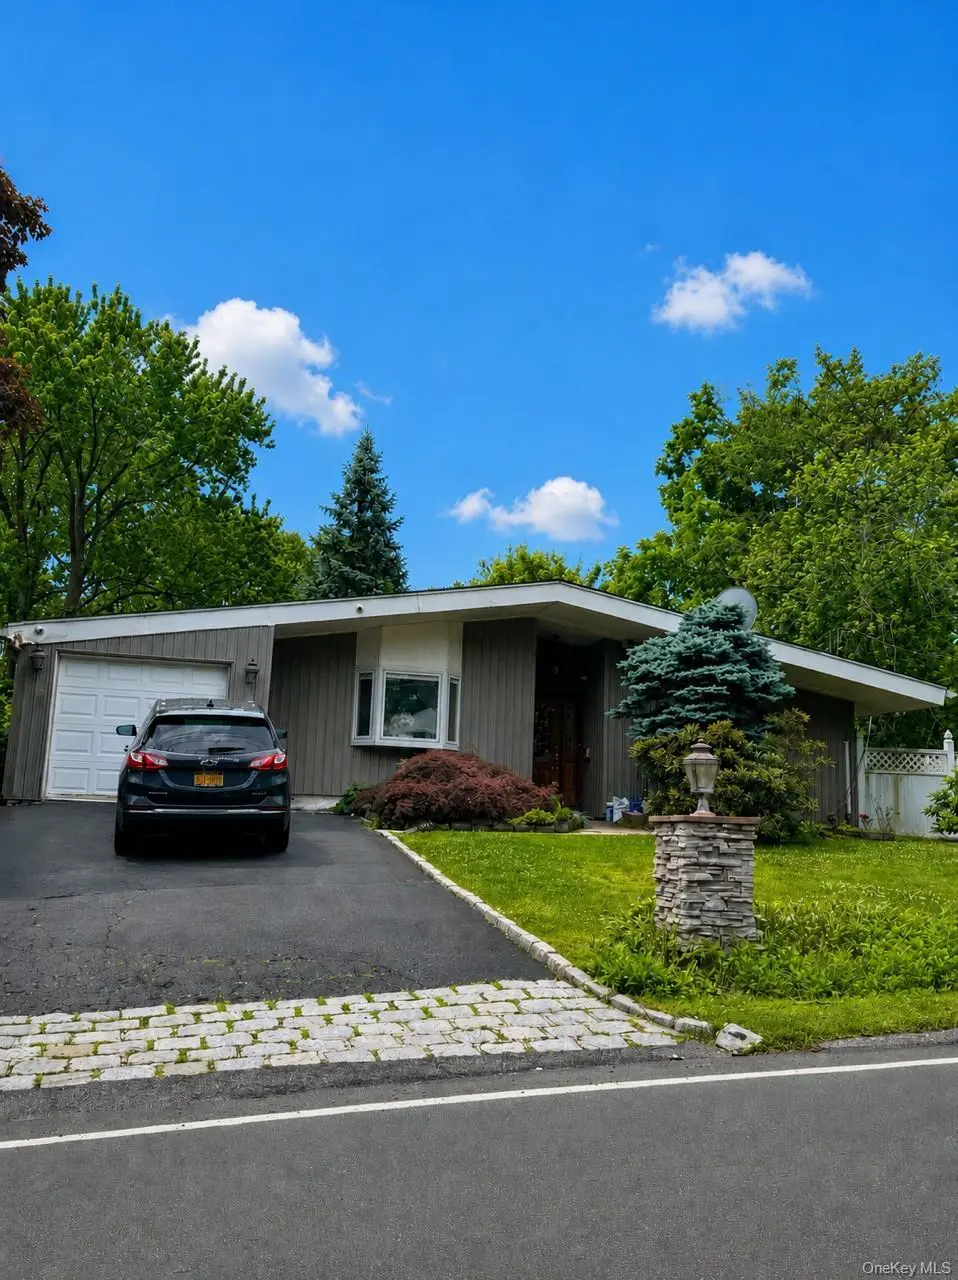
2 Edgewood Rd
Ardsley, NY 10530
$599,000D+
3 bd · 1.0 ba ·
1,851 sqft ·
Built 1953
· SingleFamily
· Active
· 6 DOM
Cashflow @ list (25.0% down · 7.5%)
Estimated rent
$6,020/mo
Mortgage (P&I)
−$3,141
Tax + insurance
−$1,797
HOA
−$0
Vac / Maint / Mgmt
−$1,264
Net cashflow
$-183/mo
Annual
$-2,191/yr
Cap rate
5.93%
Cash-on-cash
-1.31%
DSCR
0.94
1% rule
1.00%
Cash to close
$167,720
Investor read
- This is a 3-bed/1.0-bath single-family listed at $599k.
- At list price, monthly cash flow is $-183 ($-2k/yr) — negative.
- To cash-flow at today's rent, offer at most $567k (5.4% below list).
- Meets the 1% rule at list price ($6k rent vs $599k).
- Only 6 days on market — expect competitive offers; lowballing is unlikely to land.
- Recommended offer: $567k (5.4% below list) — sets the bar for cash-flow.
- Local home prices are declining (-3.0%/yr); year-one equity from $4k of loan paydown is wiped out by about $18k of value loss. Plan a longer hold.
- Location reads 75/100 on livability (#267 in NY, #4,223 nationally) — a middle-class / working-renter tenant base. Strengths: crime A+, employment A+, housing A+; Watch: amenities F, commute F, cost of living F.
- Greenburgh Central School District (suburban): math 51% / reading 55% proficiency, ranked #267 of 590 in NY (top 45%) — acceptable for families but not a draw, mixed tenant base, ~2y average lease.
- Zoned schools: Lee F Jackson School (261 students, 41% FRL); Woodlands Middle/High School (math 62% / reading 52%, grade C, #887 of 1,100 statewide, top 82%, 681 students, 66% FRL).
- Watch-outs: property tax is 3.1% of price; built in 1953 — expect roof / HVAC / electrical / plumbing capex.
- Market conditions: 156 active listings in the ZIP; 7 comparable units currently listed for rent nearby; rentals at typical pace (median 18d on market — plan ~3-4 weeks tenant-placement turnaround); 954 units permitted in Westchester County in 2024 (649 in 5+ unit buildings).
- Westchester County population projected at +10% by 2050 — modest demand growth; plan on rents tracking national, not racing it.
- 5 sale attempts since 18y ago with the ask held roughly flat each time — persistent listings suggest the price (not the market) is what's stuck; bring a comps-based counter.
- Climate carrying-cost: major wind risk, 27% chance of damaging wind over 30y; extreme-heat days projected 7→15/yr by 2055 (HVAC capex compounding) — expect insurance premiums to compound above CPI over the hold.
- Cap rate 5.9% vs local median 2.7% in Ardsley — top-decile yield for the area; either an underpriced asset or a hidden risk that comps aren't pricing in. Stress-test before assuming the spread holds.
Questions for listing agent
- What do current leases actually rent for vs. the listed asking? Can we see a recent rent roll and the last 12 months of T-12 income?
- Built in 1953 — when were the roof, HVAC, electrical panel, plumbing, and water heater last replaced?
- Property tax is high relative to price — has the assessment been appealed recently, and will the sale trigger a re-assessment?
- Is there a deadline driving the sale (1031 exchange, divorce, estate, relocation)? That informs how much negotiation room exists.
- Schools are A-rated — typically a magnet for longer-tenancy family renters. What's the average tenant stay here, and is there a school-zone premium baked into asking?
- The area grade is low — what's the realistic commute time and amenity access for the typical tenant pool here? Any planned neighborhood developments (good or bad) we should know about?
- What's the average days-on-market for RENTAL listings here right now (not sales)? A rising rental-DOM trend means longer vacancies and softer asking-rent achievability than the comps imply.
- What's the recent tenant-quality profile in this submarket — average credit score on applications, eviction rate, late-payment / NSF rate, and stable-employment percentage? A property-management company in the area should have these aggregated.
CashFlowRE · CFR-J9JDVB2J4V50X4
· Data 2 days ago
cashflowre.app · 2026-05-29