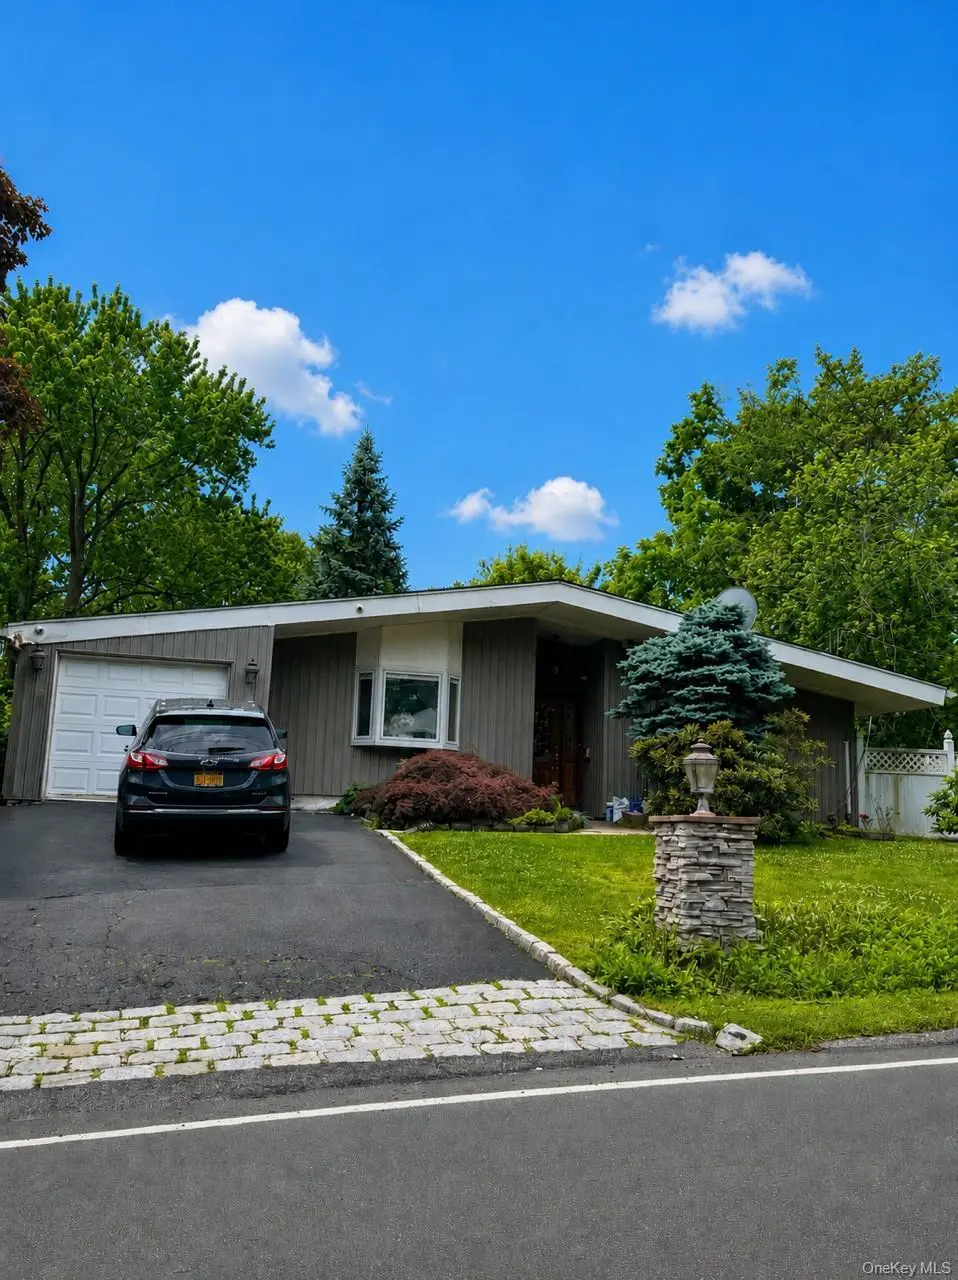
2 Edgewood Rd · Ardsley, NY
Flood risk 1/10 · Minimal
- FEMA flood zone
- X (unshaded)
- Chance of flooding over 30 yrs
- 0.0%
- Est. flood insurance / yr
- $473 – $860
Fire risk 3/10 · Minor
- Est. fire insurance / yr
- $691 – $1,283
Heat risk 5/10 · Moderate
- Hot days now (above 98°F)
- 7 days/yr
- Hot days in 30 yrs
- 15 days/yr
Wind risk 6/10 · Moderate
- Chance of severe wind over 30 yrs
- 27.0%
Air-quality risk 4/10 · Minor
- Unhealthy air days now
- 3 days/yr
- Unhealthy air days in 30 yrs
- 5 days/yr
Risk factors via First Street. Map © Google.
Why this score? — see what drove the D+ grade
The composite is a weighted blend of 9 inputs, each scored 0–100. Each bar is that input's sub-score; the figure is the points it added to the 100-point composite (weight × sub-score).
- ARV discount +15.0/15.0
- Cash flow +11.6/30.0
- 1% rule +5.0/10.0
- Schools +4.9/10.0
- Livability +3.8/5.0
- DSCR +3.4/10.0
- Rent growth +2.5/5.0
- Condition / age +2.5/5.0
- Appreciation +0.0/10.0
$599,000
🖨 Deal sheet 📄 Offer letter ✓ Due diligence
Listing remarks
Opportunity awaits in this 3-bedroom home brimming with potential. Whether you're an investor looking for your next project or a buyer with vision ready to create your dream home, this property offers endless possibilities. Featuring a functional layout, spacious rooms, and a generous footprint, this home is the perfect canvas for renovation and customization. With some TLC and creative updates, it can truly shine. Conveniently located near local amenities, shopping, dining, and transportation, this is a rare chance to add value and make it your own. Bring your imagination and unlock the potential of this hidden gem!
Key facts
- 9,681 sq ft lot
- Garage
- Built 1953
Property features AI
Exterior
- Parking: Garage (1 car)
- Utilities: Con-Edison electric; Natural gas connected; Public sewer / sewer connected
- Home design: Single family residence; Living area per public records: 1851; Property condition: Actual
- Construction: Frame construction
- Exterior features: Frame construction; Not waterfront
Interior
- Kitchen: Dishwasher; Range; Refrigerator
- Bedrooms: Total: 5 rooms (includes bedrooms and living spaces)
- Bathrooms: 1 full bathroom
- Heating & cooling: Natural gas heating; Central air conditioning
- Interior features: Open floor plan; First-floor bedroom; Basement (see remarks)
- Laundry & utility: Washer; Dryer
Neighborhood map
What this means for you Summary
Snapshot
- This is a 3-bed/1.0-bath single-family listed at $599k.
Deal economics
- At list price, monthly cash flow is $-183 ($-2k/yr) — negative.
- To cash-flow at today's rent, offer at most $567k (5.4% below list).
- Meets the 1% rule at list price ($6k rent vs $599k).
- Recommended offer: $567k (5.4% below list) — sets the bar for cash-flow.
- Cap rate 5.9% vs local median 2.7% in Ardsley — top-decile yield for the area; either an underpriced asset or a hidden risk that comps aren't pricing in. Stress-test before assuming the spread holds.
Location & tenants
- Location reads 75/100 on livability (#267 in NY, #4,223 nationally) — a middle-class / working-renter tenant base. Strengths: crime A+, employment A+, housing A+; Watch: amenities F, commute F, cost of living F.
- Greenburgh Central School District (suburban): math 51% / reading 55% proficiency, ranked #267 of 590 in NY (top 45%) — acceptable for families but not a draw, mixed tenant base, ~2y average lease.
- Zoned schools: Lee F Jackson School (261 students, 41% FRL); Woodlands Middle/High School (math 62% / reading 52%, grade C, #887 of 1,100 statewide, top 82%, 681 students, 66% FRL).
- Market conditions: 156 active listings in the ZIP; 7 comparable units currently listed for rent nearby; rentals at typical pace (median 17d on market — plan ~3-4 weeks tenant-placement turnaround); 954 units permitted in Westchester County in 2024 (649 in 5+ unit buildings).
Forward outlook
- Local home prices are declining (-3.0%/yr); year-one equity from $4k of loan paydown is wiped out by about $18k of value loss. Plan a longer hold.
- Westchester County population projected at +10% by 2050 — modest demand growth; plan on rents tracking national, not racing it.
Negotiation context
- Only 6 days on market — expect competitive offers; lowballing is unlikely to land.
- 5 sale attempts since 18y ago with the ask held roughly flat each time — persistent listings suggest the price (not the market) is what's stuck; bring a comps-based counter.
Risks & watch-outs
- Watch-outs: property tax is 3.1% of price; built in 1953 — expect roof / HVAC / electrical / plumbing capex.
- Climate carrying-cost: major wind risk, 27% chance of damaging wind over 30y; extreme-heat days projected 7→15/yr by 2055 (HVAC capex compounding) — expect insurance premiums to compound above CPI over the hold.
Questions for the listing agent
- What do current leases actually rent for vs. the listed asking? Can we see a recent rent roll and the last 12 months of T-12 income?
- Built in 1953 — when were the roof, HVAC, electrical panel, plumbing, and water heater last replaced?
- Property tax is high relative to price — has the assessment been appealed recently, and will the sale trigger a re-assessment?
- Is there a deadline driving the sale (1031 exchange, divorce, estate, relocation)? That informs how much negotiation room exists.
- Schools are A-rated — typically a magnet for longer-tenancy family renters. What's the average tenant stay here, and is there a school-zone premium baked into asking?
- The area grade is low — what's the realistic commute time and amenity access for the typical tenant pool here? Any planned neighborhood developments (good or bad) we should know about?
- What's the average days-on-market for RENTAL listings here right now (not sales)? A rising rental-DOM trend means longer vacancies and softer asking-rent achievability than the comps imply.
- What's the recent tenant-quality profile in this submarket — average credit score on applications, eviction rate, late-payment / NSF rate, and stable-employment percentage? A property-management company in the area should have these aggregated.
- How much new for-sale + rental construction is in the pipeline within 1–3 miles? Heavy new supply typically softens prices + rents 12–24 months out; constrained supply supports both.
Investment metrics
- 1% rule
- 1.00% ✓
- Cap rate
- 5.93%
- Cash-on-cash
- -1.31%
- DSCR
- 0.94
- GRM
- 8.3
CMA / ARV
- ARV (on-the-fly)
- $1,023,603
- Comps found
- 12
Show comp detail 12 sales within ~0.75 mi
| Address | Dist | Beds/Ba | Sqft | Sold | Price | $/sf | Match |
|---|---|---|---|---|---|---|---|
| 28 Moore St | 0.31mi | 3/3.0 | 1,800 (-3%) | 2mo | $776,000 | $431 | 71 |
| 635 Secor Rd | 0.45mi | 4/1.5 (+1) | 1,850 (-0%) | 5mo | $930,000 | $503 | 68 |
| 9 Northern Rd | 0.51mi | 3/1.5 | 1,782 (-4%) | 2mo | $985,000 | $553 | 67 |
| 20 Shelley Ave | 0.70mi | 4/2.0 (+1) | 1,778 (-4%) | 2mo | $820,000 | $461 | 50 |
| 4 Richard Ter | 0.74mi | 3/2.0 | 1,719 (-7%) | 0mo | $1,050,000 | $611 | 49 |
| 33 Overlook Rd | 0.74mi | 3/2.0 | 1,659 (-10%) | 0mo | $1,070,000 | $645 | 44 |
| 5 Birch St W | 0.61mi | 3/2.0 | 1,579 (-15%) | 1mo | $947,670 | $600 | 42 |
| 10 Wayside Dr | 0.70mi | 3/2.0 | 1,701 (-8%) | 9mo | $740,000 | $435 | 42 |
| 48 Joyce Rd | 0.52mi | 3/2.0 | 1,597 (-14%) | 8mo | $990,000 | $620 | 42 |
| 15 Carlyle Pl | 0.73mi | 3/2.0 | 1,619 (-12%) | 6mo | $745,000 | $460 | 36 |
| 7 Green Acres Ln | 0.60mi | 3/2.5 | 1,575 (-15%) | 6mo | $885,000 | $562 | 36 |
| 4 Ivy Pl | 0.67mi | 4/2.0 (+1) | 1,620 (-12%) | 6mo | $810,000 | $500 | 34 |
Match score weights: distance 35% · size 25% · config 20% · recency 20%. Top-matched comps best support the ARV.
Projected returns pro-forma
-3.0% appreciation · 3.0% rent growth · sell at horizon
- IRR
- -18.3%
- Equity multiple
- 0.36×
- Total profit
- $-108,111
- Equity at exit
- $89,313
- IRR
- -10.4%
- Equity multiple
- 0.36×
- Total profit
- $-106,752
- Equity at exit
- $51,791
Cash invested: $167,720 (down + closing). Projections, not guarantees.
Landlord ↔ Tenant lean methodology
- Overall (STATE)
- 15 Strongly Tenant-Friendly
- State New York
- 15 Strongly Tenant-Friendly · D+10
- County
- — inherits STATE
- City
- — inherits STATE
ZIP-level market 10530
- Active inventory
- 156
- Price-to-rent
- 8.3×
Monthly cashflow live
- Estimated rent
- $6,020 high interval (Pro) →
- Mortgage (P&I)
- −$3,141
- Tax from tax record
- −$1,547 /mo · $18,569/yr
- Insurance
- −$250
- HOA
- −$0
- Vacancy / Maint / Mgmt
- −$1,264
- Net cashflow
- $-183
Break-even live
UW: 25.0% down · 7.5% · 30yr · 1.5% tax · 5.0% vac · 8.0% maint · 8.0% mgmt
Financing live
Cash to close
- Down payment
- $149,750
- Closing costs
- $17,970
- Reserves months
- —
- Total cash needed
- —
Loan-product check · same deal, 3 products live
Conventional
25% down · 7.5% · 30yr
- Down + closing
- —
- Monthly P&I
- —
- Monthly cashflow
- —
- DSCR
- —
- Eligible?
- —
Personal DTI + credit; lowest rate.
DSCR
20% down · 8.5% · 30yr
- Down + closing
- —
- Monthly P&I
- —
- Monthly cashflow
- —
- DSCR
- —
- Eligible?
- —
No personal income docs; deal must DSCR.
Hard money
10% down · 12.0% · 12mo
- Down + closing
- —
- Monthly P&I
- —
- Monthly cashflow
- —
- DSCR
- —
- Eligible?
- —
Short-term bridge; refi at stabilization.
Rent comps 7 comps
| Address | Beds | Baths | Sqft | Rent | $/sqft | DOM | Units | Dist |
|---|---|---|---|---|---|---|---|---|
| 181 Finmor Dr White Plains, NY | 3.0 | 1.5 | 1789 | $6,200 | $3.47 | 18d | 1 | 1.01mi |
| 15 Homewood Rd Hartsdale, NY | 3.0 | 2.0 | 1868 | $7,000 | $3.75 | 24d | 1 | 1.11mi |
| 846 Hartsdale Rd White Plains, NY | 3.0 | 2.5 | 1500 | $5,200 | $3.47 | 17d | 1 | 1.32mi |
| 12 Francine Ct White Plains, NY | 4.0 | 2.5 | 2000 | $6,800 | $3.40 | 15d | 1 | 1.35mi |
| 250 S Central Ave Apt 4A Hartsdale, NY | 2.0 | 1.0 | 1289 | $4,350 | $3.37 | 16d | 1 | 1.37mi |
| 250 S Central Ave Hartsdale, NY | 1.0–2.0 | 1.0–2.0 | 1084 | $5,500 | $5.07 | 1d | 1 | 1.38mi |
| 124 Northfield Ave Dobbs Ferry, NY | 3.0 | 3.0 | 1872 | $6,000 | $3.21 | 43d | 1 | 1.45mi |
Listing history 6 events
-
2026-06-18days on market $599,000 Active 6 DOM
-
2026-06-17days on market $599,000 Active 5 DOM
-
2026-06-16days on market $599,000 Active 4 DOM
-
2026-06-15days on market $599,000 Active 3 DOM
-
2026-06-13remarks 624-char remark
-
2026-06-13$599,000 Active 1 DOM
ⓘ Source: listings_history table (triggers on properties + properties_extension) + one-shot
backfill from property_details.listing_events for pre-trigger history.
Tax reassessment forecast NY · Partial reset (capped growth)
- Current annual tax
- $18,569 · $1,547/mo
- Projected year-2 tax
- $18,569 · $1,547/mo
- Expected delta
- $0/yr ($0/mo · 0.0%)
ⓘ Screening estimate from a state-policy table — verify with the county assessor before closing.
Climate risk First Street
- Flood 1/10 Low FEMA zone X (unshaded) · 0% chance over 30 yrs
- Wildfire 3/10 Moderate
- Heat 5/10 Major 7 d/yr ≥98°F today · 15 d/yr by 30 yrs out
- Wind 6/10 Major 27% chance of damaging wind over 30 yrs
- Air quality 4/10 Moderate 3 unhealthy d/yr today · 5 by 30 yrs out
Nearby sold comps map
Loading sold comps map…
Walkable amenities ~0.75 mi
Loading nearby amenities…
Taxation est. · year 1
- Rental income
- $72,237
- − Mortgage interest
- −$33,553
- − Property taxes
- −$18,569
- − Insurance
- −$2,995
- − Repairs & maintenance
- −$5,779
- − Management
- −$5,779
- − Depreciation
- −$17,425
- Taxable loss
- −$11,863
- Est. tax savings @ 24.0%
- +$2,847
- After-tax cash flow
- $656/yr
For passive investors: Depreciation is non-cash, so a rental often shows a tax loss while cash-flowing — sheltering income. Rental losses are passive: they offset passive income freely, and up to $25,000/yr can offset ordinary (W-2) income if you actively participate and your MAGI is under $100k (phasing out to $0 by $150k); unused losses carry forward. On sale, claimed depreciation is recaptured at up to 25%, and gains may owe capital-gains tax (a 1031 exchange can defer both). Figures are a year-1 estimate at your 24.0% rate — not tax advice; consult a CPA.
Schools (NCES district)
- District
- Greenburgh Central School District
- NCES district ID
- 3612720
- Math proficiency
- 51% ▲ 4.00%
- Reading proficiency
- 55% ▲ 5.00%
- Median HH income
- $93,626
- Composite
- 49.43/100
- National rank
- #2005
- State rank
- #267 of 590 in NY
Livability — Ardsley
- Score
- 75/100
- State rank
- #267
- US rank
- #4223
Category grades
Schools grade is shown separately in the Schools card above.
Census & demographics
- City population
- 5,875
- Population (ZIP)
- 13,955
Population outlook (Westchester County) Hauer SSP2
- Today (2025)
- 1,028,035 people
- By 2030
- 1,051,636 · +2.3%
- By 2040
- 1,098,520 · +6.9%
- By 2050
- 1,136,044 · +10.5%
- By 2075
- 1,196,925 · +16.4%
- By 2100
- 1,175,147 · +14.3%
Race, ethnicity, and origin ACS 2023
- Neighborhood character
- Predominantly White (68%)
- Race & ethnicity
- White 68% Hispanic / Latino 12% Asian 10% Two or more races 9% Black 7%
- Hispanic origin (detail)
- Mexican 2% Puerto Rican 4% Dominican 2%
- Common ancestry
- Romanian 9% Scotch-Irish 5% Italian 2%
- Foreign-born
- 23% · Canada, China, South Korea
- Languages at home
- 71% English-only · Spanish 9% Other Indo-European 6% Russian/Polish/Slavic 5%
Political lean MEDSL · Westchester
- 2024 margin
- Strong D (+26.3) · D 63.1% · R 36.9%
- 2008→2024 swing
- -1.3pp toward R · 2008: 27.6pp · 2024: 26.3pp
- All cycles
- 2024: D+26.3 2020: D+36.3 2016: D+32.8 2012: D+22.2 2008: D+27.6
Not yet ingested
- Civics
- —
Market trends
- HPI YoY
- ▼ -616.16%
- Current HPI
- 320.7324
- Rent YoY
- —
- Metro
- —
- State GDP YoY
- ▲ 2.60%
- F500 in state
- 92
Industry mix (Fortune 500 HQ in NY)
| Industry | F500 HQs | Revenue |
|---|---|---|
| Financial Services | 10 | $950B |
|
||
| Consumer Goods | 9 | $162B |
|
||
| Insurance | 4 | $225B |
|
||
| Telecommunications | 2 | $144B |
|
||
| Pharmaceuticals | 2 | $112B |
|
||
| Media / Entertainment | 2 | $69B |
|
||
Price history
+134.9% since first listed13 events — show timeline
- 2026-06-12 Listed $599,000 OneKey® MLS as Distributed by MLS Grid
- 2024-12-16 Price Changed $659,000 OneKey® MLS as Distributed by MLS Grid
- 2024-11-13 Listed $699,000 OneKey® MLS as Distributed by MLS Grid
- 2024-11-01 Coming Soon — OneKey® MLS as Distributed by MLS Grid
- 2024-10-25 Price Changed $750,000 OneKey® MLS as Distributed by MLS Grid
- 2024-10-24 Price Changed $730,000 OneKey® MLS as Distributed by MLS Grid
- 2024-10-24 Listed $750,000 OneKey® MLS as Distributed by MLS Grid
- 2008-12-30 Sold (Public Records) $540,000 Public Records
- 2008-08-16 Delisted — HGMLS
- 2008-07-17 Delisted — HGMLS
- 2008-07-17 Listed — HGMLS
- 2008-01-24 Listed — HGMLS
- 1988-07-19 Sold (Public Records) $255,000 Public Records
Property tax history
+6.5%/yrLatest (2025): $18,569 · +6.5% YoY. Source: county tax records.
Cash-flow waterfall
monthlySold comps — $/sqft
last 12 mo · ≤1 miLoading sold comps…