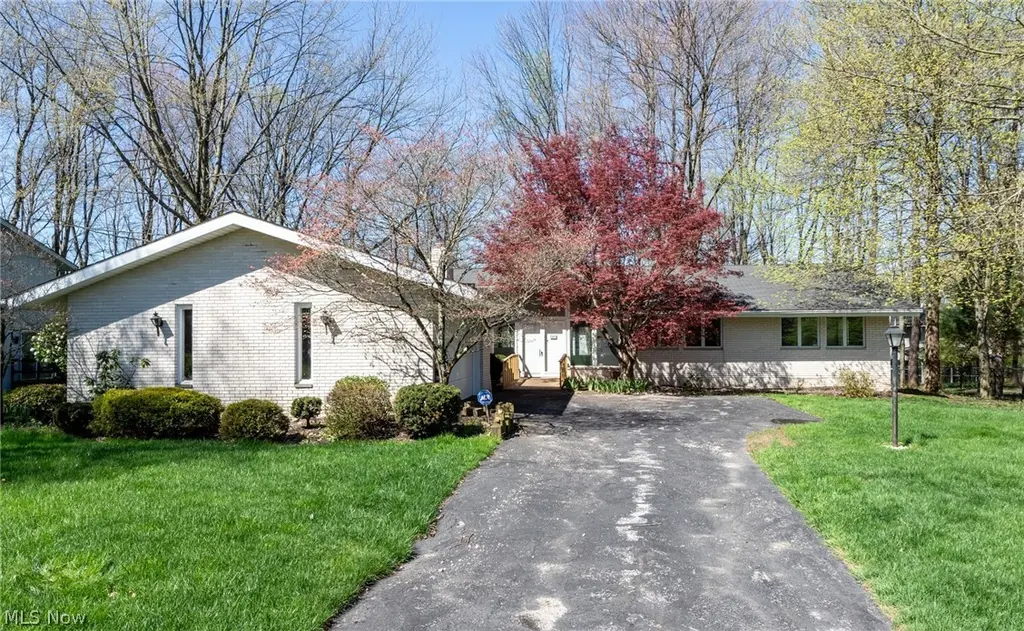
3970 E Meadow Ln
Orange, OH 44122
$469,900C
3 bd · 2.5 ba ·
2,216 sqft ·
Built 1979
· SingleFamily
· Pending
· 4 DOM
Cashflow @ list (25.0% down · 7.5%)
Estimated rent
$4,873/mo
Mortgage (P&I)
−$2,464
Tax + insurance
−$739
HOA
−$29
Vac / Maint / Mgmt
−$1,023
Net cashflow
$617/mo
Annual
$7,410/yr
Cap rate
7.87%
Cash-on-cash
5.63%
DSCR
1.25
1% rule
1.04%
Cash to close
$131,572
Investor read
- This is a 3-bed/2.5-bath single-family listed at $470k.
- At list price, monthly cash flow is $617 ($7k/yr) — positive.
- The deal already cash-flows at list — no discount required.
- Meets the 1% rule at list price ($5k rent vs $470k).
- Only 4 days on market — expect competitive offers; lowballing is unlikely to land.
- Local home prices are declining (-3.0%/yr); year-one equity from $3k of loan paydown is wiped out by about $14k of value loss. Plan a longer hold.
- Location reads 70/100 on livability (#452 in OH) — a middle-class / working-renter tenant base. Strengths: crime A+, employment A+, housing A+; Watch: cost of living D, health & safety D, amenities F.
- Orange City (suburban): math 76% / reading 83% proficiency, ranked #32 of 656 in OH (top 5%) — strong family-tenant draw, lease renewals of 3-5y typical; only 11% free/reduced lunch — higher-income household profile.
- Zoned schools: Moreland Hills Elementary School (math 84% / reading 83%, grade A+, #96 of 1,584 statewide, top 6%, 919 students, 9% FRL); Ballard Brady Middle School (math 77% / reading 84%, grade A+, #41 of 654 statewide, top 7%, 433 students, 7% FRL); Orange High School (math 57% / reading 77%, grade B, #137 of 781 statewide, top 19%, 608 students, 10% FRL) — zoned schools at 9% FRL track the district average.
- Market conditions: Rents rising (+1.1%/yr); 183 active listings in the ZIP; 3 comparable units currently listed for rent nearby; rentals at typical pace (median 26d on market — plan ~3-4 weeks tenant-placement turnaround); solid renter incomes; 1,441 units permitted in Cuyahoga County in 2024 (700 in 5+ unit buildings).
- Cuyahoga County population projected to shrink 8% by 2050 — rents likely to lag national; underwrite the cash flow, not the appreciation.
- 6 sale attempts since 34y ago with the ask held roughly flat each time — persistent listings suggest the price (not the market) is what's stuck; bring a comps-based counter.
- Current owner paid $248k; list at $470k implies a 89% gain — meaningful room to come down on a strong offer.
- Cap rate 7.9% vs local median 1.2% in Orange — top-decile yield for the area; either an underpriced asset or a hidden risk that comps aren't pricing in. Stress-test before assuming the spread holds.
- At $4,873/mo this rent would consume 58% of the median local household income ($101k/yr) (locally 1294% of renters already pay >50% of income on rent) — very limited rent-growth headroom before tenants either downsize or default.
Questions for listing agent
- Built in 1979 — when were the roof, HVAC, electrical panel, plumbing, and water heater last replaced?
- What does the HOA fee cover, when was the last increase, and are there any pending special assessments or reserve-fund shortfalls?
- Is there a deadline driving the sale (1031 exchange, divorce, estate, relocation)? That informs how much negotiation room exists.
- What's the average days-on-market for RENTAL listings here right now (not sales)? A rising rental-DOM trend means longer vacancies and softer asking-rent achievability than the comps imply.
- What's the recent tenant-quality profile in this submarket — average credit score on applications, eviction rate, late-payment / NSF rate, and stable-employment percentage? A property-management company in the area should have these aggregated.
- How much new for-sale + rental construction is in the pipeline within 1–3 miles? Heavy new supply typically softens prices + rents 12–24 months out; constrained supply supports both.
CashFlowRE · CFR-J9QAWD25PGDE46
· Data 4 weeks ago
cashflowre.app · 2026-05-29