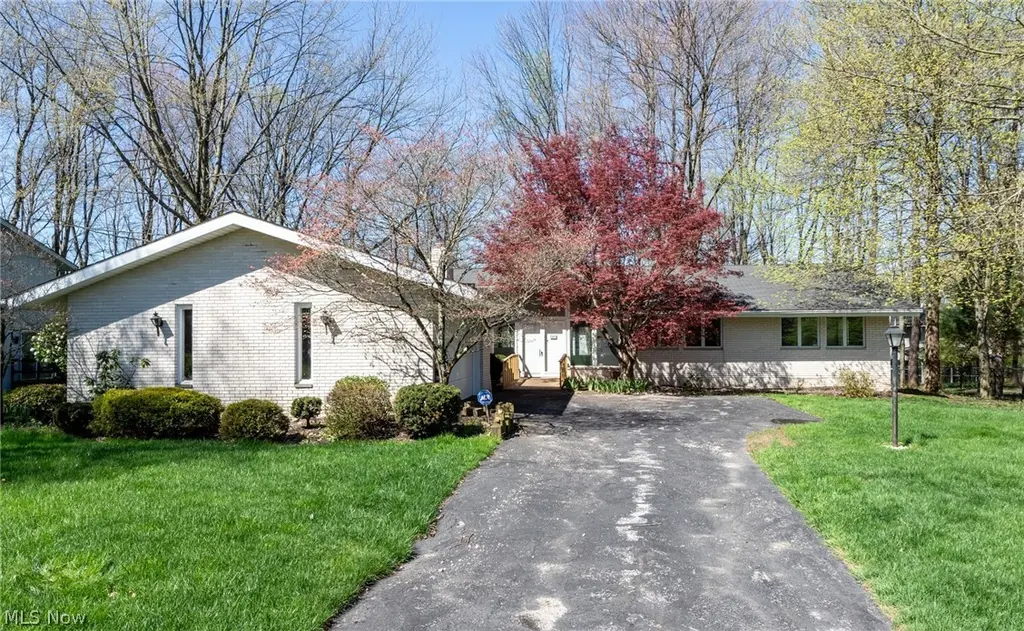
3970 E Meadow Ln · Orange, OH
Flood risk 1/10 · Minimal
- FEMA flood zone
- X (unshaded)
- Chance of flooding over 30 yrs
- 0.0%
- Est. flood insurance / yr
- $473 – $860
Fire risk 1/10 · Minimal
- Est. fire insurance / yr
- $713 – $1,323
Heat risk 2/10 · Minimal
- Hot days now (above 94°F)
- 7 days/yr
- Hot days in 30 yrs
- 17 days/yr
Wind risk 1/10 · Minimal
- Chance of severe wind over 30 yrs
- —
Air-quality risk 3/10 · Minor
- Unhealthy air days now
- 2 days/yr
- Unhealthy air days in 30 yrs
- 5 days/yr
Risk factors via First Street. Map © Google.
Why this score? — see what drove the C grade
The composite is a weighted blend of 9 inputs, each scored 0–100. Each bar is that input's sub-score; the figure is the points it added to the 100-point composite (weight × sub-score).
- Cash flow +20.5/30.0
- ARV discount +8.1/15.0
- Schools +7.3/10.0
- DSCR +6.5/10.0
- 1% rule +5.4/10.0
- Livability +3.5/5.0
- Rent growth +2.8/5.0
- Condition / age +2.5/5.0
- Appreciation +0.0/10.0
$469,900
🖨 Deal sheet (PDF) 📄 Offer letter ✓ Due diligence
Listing remarks MLS
Absolutely Beautiful Contemporary, Loaded With Upgrades! Newer Wood Floors Run From The Updated Kitchen Into The Fam Rm With Wbfp And Wet Bar. Master Suite With Walk-in Closet. Lovely Big Windows In Lr & Dr, Bright And Neutral Throughout! Updated Baths, Huge Basement Rec Rm, Dog Run.
Key facts
- Wood floors
- Accessible entrance
- Double ovens
Tags
Neighborhood map
What this means for you Summary
Snapshot
- This is a 3-bed/2.5-bath single-family listed at $470k.
Deal economics
- At list price, monthly cash flow is $617 ($7k/yr) — positive.
- The deal already cash-flows at list — no discount required.
- Meets the 1% rule at list price ($5k rent vs $470k).
- Cap rate 7.9% vs local median 1.2% in Orange — top-decile yield for the area; either an underpriced asset or a hidden risk that comps aren't pricing in. Stress-test before assuming the spread holds.
Location & tenants
- Location reads 70/100 on livability (#452 in OH) — a middle-class / working-renter tenant base. Strengths: crime A+, employment A+, housing A+; Watch: cost of living D, health & safety D, amenities F.
- Orange City (suburban): math 76% / reading 83% proficiency, ranked #32 of 656 in OH (top 5%) — strong family-tenant draw, lease renewals of 3-5y typical; only 11% free/reduced lunch — higher-income household profile.
- Zoned schools: Moreland Hills Elementary School (math 84% / reading 83%, grade A+, #96 of 1,584 statewide, top 6%, 919 students, 9% FRL); Ballard Brady Middle School (math 77% / reading 84%, grade A+, #41 of 654 statewide, top 7%, 433 students, 7% FRL); Orange High School (math 57% / reading 77%, grade B, #137 of 781 statewide, top 19%, 608 students, 10% FRL) — zoned schools at 9% FRL track the district average.
- Market conditions: Rents rising (+1.1%/yr); 183 active listings in the ZIP; 3 comparable units currently listed for rent nearby; rentals at typical pace (median 26d on market — plan ~3-4 weeks tenant-placement turnaround); solid renter incomes; 1,441 units permitted in Cuyahoga County in 2024 (700 in 5+ unit buildings).
- At $4,873/mo this rent would consume 58% of the median local household income ($101k/yr) (locally 1294% of renters already pay >50% of income on rent) — very limited rent-growth headroom before tenants either downsize or default.
Forward outlook
- Local home prices are declining (-3.0%/yr); year-one equity from $3k of loan paydown is wiped out by about $14k of value loss. Plan a longer hold.
- Cuyahoga County population projected to shrink 8% by 2050 — rents likely to lag national; underwrite the cash flow, not the appreciation.
Negotiation context
- Only 4 days on market — expect competitive offers; lowballing is unlikely to land.
- 6 sale attempts since 34y ago with the ask held roughly flat each time — persistent listings suggest the price (not the market) is what's stuck; bring a comps-based counter.
- Current owner paid $248k; list at $470k implies a 89% gain — meaningful room to come down on a strong offer.
Questions for the listing agent
- Built in 1979 — when were the roof, HVAC, electrical panel, plumbing, and water heater last replaced?
- What does the HOA fee cover, when was the last increase, and are there any pending special assessments or reserve-fund shortfalls?
- Is there a deadline driving the sale (1031 exchange, divorce, estate, relocation)? That informs how much negotiation room exists.
- What's the average days-on-market for RENTAL listings here right now (not sales)? A rising rental-DOM trend means longer vacancies and softer asking-rent achievability than the comps imply.
- What's the recent tenant-quality profile in this submarket — average credit score on applications, eviction rate, late-payment / NSF rate, and stable-employment percentage? A property-management company in the area should have these aggregated.
- How much new for-sale + rental construction is in the pipeline within 1–3 miles? Heavy new supply typically softens prices + rents 12–24 months out; constrained supply supports both.
Investment metrics
- 1% rule
- 1.04% ✓
- Cap rate
- 7.87%
- Cash-on-cash
- 5.63%
- DSCR
- 1.25
- GRM
- 8.0
CMA / ARV
- ARV (on-the-fly)
- $476,440
- Comps found
- 8
Show comp detail 8 sales within ~0.75 mi
| Address | Dist | Beds/Ba | Sqft | Sold | Price | $/sf | Match |
|---|---|---|---|---|---|---|---|
| 3970 E Meadow Ln | 0.00mi | 3/2.5 | 2,216 (0%) | 1mo | $455,000 | $205 | 99 |
| 3959 E Meadow Ln | 0.05mi | 4/2.5 (+1) | 2,420 (+9%) | 10mo | $579,000 | $239 | 69 |
| 29800 Harvard Rd | 0.26mi | 4/2.0 (+1) | 2,288 (+3%) | 19mo | $315,000 | $138 | 60 |
| 29650 N Hilltop Rd | 0.52mi | 3/2.0 | 2,023 (-9%) | 5mo | $330,000 | $163 | 55 |
| 3938 W Meadow Ln | 0.10mi | 4/2.5 (+1) | 2,536 (+14%) | 19mo | $300,000 | $118 | 51 |
| 4249 Lander Rd | 0.58mi | 4/2.0 (+1) | 2,230 (+1%) | 18mo | $479,000 | $215 | 50 |
| 3959 Beechmont Trl | 0.38mi | 3/2.5 | 2,462 (+11%) | 19mo | $550,000 | $223 | 48 |
| 4300 Orangedale Rd | 0.73mi | 4/3.0 (+1) | 2,523 (+14%) | 22mo | $650,000 | $258 | 17 |
Match score weights: distance 35% · size 25% · config 20% · recency 20%. Top-matched comps best support the ARV.
Projected returns pro-forma
-3.0% appreciation · 1.15% rent growth · sell at horizon
- IRR
- -9.7%
- Equity multiple
- 0.65×
- Total profit
- $-45,658
- Equity at exit
- $70,064
- IRR
- -3.0%
- Equity multiple
- 0.82×
- Total profit
- $-24,071
- Equity at exit
- $40,628
Cash invested: $131,572 (down + closing). Projections, not guarantees.
Landlord ↔ Tenant lean methodology
- Overall (STATE)
- 73 Landlord-Friendly
- State Ohio
- 73 Landlord-Friendly · R+6
- County
- — inherits STATE
- City
- — inherits STATE
ZIP-level market 44122
- Rents YoY
- 1.1%
- Active inventory
- 183
- Price-to-rent
- 8.0×
Monthly cashflow live
- Estimated rent
- $4,873 medium interval (Pro) →
- Mortgage (P&I)
- −$2,464
- Tax from tax record
- −$543 /mo · $6,518/yr
- Insurance
- −$196
- HOA
- −$29
- Vacancy / Maint / Mgmt
- −$1,023
- Net cashflow
- $617
Break-even live
Sensitivity live
| Price | -10% $883 | -5% $750 | +0% $617 | +5% $484 | +10% $351 |
|---|---|---|---|---|---|
| Rent | -10% $233 | -5% $425 | +0% $617 | +5% $810 | +10% $1,002 |
| Rate | -1.0pp $854 | -0.5pp $737 | base $617 | +0.5pp $496 | +1.0pp $372 |
UW: 25.0% down · 7.5% · 30yr · 1.5% tax · 5.0% vac · 8.0% maint · 8.0% mgmt
Financing live
Cash to close
- Down payment
- $117,475
- Closing costs
- $14,097
- Reserves months
- —
- Total cash needed
- —
Loan-product check · same deal, 3 products live
Conventional
25% down · 7.5% · 30yr
- Down + closing
- —
- Monthly P&I
- —
- Monthly cashflow
- —
- DSCR
- —
- Eligible?
- —
Personal DTI + credit; lowest rate.
DSCR
20% down · 8.5% · 30yr
- Down + closing
- —
- Monthly P&I
- —
- Monthly cashflow
- —
- DSCR
- —
- Eligible?
- —
No personal income docs; deal must DSCR.
Hard money
10% down · 12.0% · 12mo
- Down + closing
- —
- Monthly P&I
- —
- Monthly cashflow
- —
- DSCR
- —
- Eligible?
- —
Short-term bridge; refi at stabilization.
Rent comps 3 comps
| Address | Beds | Baths | Sqft | Rent | $/sqft | DOM | Units | Dist |
|---|---|---|---|---|---|---|---|---|
| 28649 Jackson Rd Unit 1496119P Chagrin Falls, OH | 4.0 | 3.5 | 1603 | $10,974 | $6.85 | 25d | 1 | 0.92mi |
| 3659 Brainard Rd Beachwood, OH | 3.0 | 2.0 | 1649 | $2,995 | $1.82 | 3d | 1 | 0.93mi |
| 6126 N Pointe Dr Cleveland, OH | 4.0 | 3.5 | 2376 | $3,300 | $1.39 | 45d | 1 | 1.47mi |
HOA detail
- Monthly dues
- $29 · $348/yr
Listing history 17 events
-
2026-04-25status Pending
-
2026-04-21$469,900 Active
-
2026-03-23historical
-
2026-01-12price $499,000
-
2025-11-30price $524,900
-
2025-11-05$550,000 Active
-
1997-12-18soldstatus $248,000 291-char remark
Show marketing remark (291 chars)
Absolutely Beautiful Contemporary, Loaded With Upgrades! Newer Wood Floors Run From The Updated Kitchen Into The Fam Rm With Wbfp And Wet Bar. Master Suite With Walk-in Closet. Lovely Big Windows In Lr & Dr, Bright And Neutral Throughout! Updated Baths, Huge Basement Rec Rm, Dog Run.
-
1997-11-29historical 291-char remark
Show marketing remark (291 chars)
Absolutely Beautiful Contemporary, Loaded With Upgrades! Newer Wood Floors Run From The Updated Kitchen Into The Fam Rm With Wbfp And Wet Bar. Master Suite With Walk-in Closet. Lovely Big Windows In Lr & Dr, Bright And Neutral Throughout! Updated Baths, Huge Basement Rec Rm, Dog Run.
-
1997-09-19soldstatus $240,000
-
1997-05-29$258,000 291-char remark
Show marketing remark (291 chars)
Absolutely Beautiful Contemporary, Loaded With Upgrades! Newer Wood Floors Run From The Updated Kitchen Into The Fam Rm With Wbfp And Wet Bar. Master Suite With Walk-in Closet. Lovely Big Windows In Lr & Dr, Bright And Neutral Throughout! Updated Baths, Huge Basement Rec Rm, Dog Run.
-
1993-12-13soldstatus $227,000
-
1993-12-13soldstatus $212,000
-
1993-10-14$234,000
-
1993-10-13historical
-
1993-01-13$239,900
-
1992-12-01historical
-
1992-08-03$269,000
ⓘ Source: listings_history table (triggers on properties + properties_extension) + one-shot
backfill from property_details.listing_events for pre-trigger history.
Tax reassessment forecast OH · Partial reset (capped growth)
- Current annual tax
- $6,518 · $543/mo
- Projected year-2 tax
- $6,924 · $577/mo
- Expected delta
- +$406/yr (+$34/mo · 6.2%)
ⓘ Screening estimate from a state-policy table — verify with the county assessor before closing.
Climate risk First Street
- Flood 1/10 Low FEMA zone X (unshaded) · 0% chance over 30 yrs
- Wildfire 1/10 Low
- Heat 2/10 Low 7 d/yr ≥94°F today · 17 d/yr by 30 yrs out
- Wind 1/10 Low
- Air quality 3/10 Moderate 2 unhealthy d/yr today · 5 by 30 yrs out
Nearby sold comps map
Loading sold comps map…
Walkable amenities ~0.75 mi
Loading nearby amenities…
Taxation est. · year 1
- Rental income
- $58,476
- − Mortgage interest
- −$26,322
- − Property taxes
- −$6,518
- − Insurance
- −$2,350
- − Repairs & maintenance
- −$4,678
- − Management
- −$4,678
- − HOA
- −$348
- − Depreciation
- −$13,670
- Taxable loss
- −$87
- Est. tax savings @ 24.0%
- +$21
- After-tax cash flow
- $7,431/yr
For passive investors: Depreciation is non-cash, so a rental often shows a tax loss while cash-flowing — sheltering income. Rental losses are passive: they offset passive income freely, and up to $25,000/yr can offset ordinary (W-2) income if you actively participate and your MAGI is under $100k (phasing out to $0 by $150k); unused losses carry forward. On sale, claimed depreciation is recaptured at up to 25%, and gains may owe capital-gains tax (a 1031 exchange can defer both). Figures are a year-1 estimate at your 24.0% rate — not tax advice; consult a CPA.
Schools (NCES district)
- District
- Orange City
- NCES district ID
- 3910016
- Math proficiency
- 76% ▼ -11.00%
- Reading proficiency
- 83% ▼ -6.00%
- Median HH income
- $114,295
- Composite
- 73.37/100
- National rank
- #182
- State rank
- #32 of 656 in OH
Livability — Orange
- Score
- 70/100
- State rank
- #452
- US rank
- #7361
Category grades
Schools grade is shown separately in the Schools card above.
Census & demographics
- Census place
- Orange, OH
- County
- Cuyahoga County · 1,090,369 people
- Metro
- Cleveland-Elyria, OH
- Population (ZIP)
- 36,678
- Household income
- $101,230
- Rent vs Own
- Severe rent burden
- 1294.0
Population outlook (Cuyahoga County) Hauer SSP2
- Today (2025)
- 1,244,621 people
- By 2030
- 1,230,093 · -1.2%
- By 2040
- 1,189,108 · -4.5%
- By 2050
- 1,145,706 · -7.9%
- By 2075
- 1,076,557 · -13.5%
- By 2100
- 978,987 · -21.3%
Race, ethnicity, and origin ACS 2023
- Neighborhood character
- Diverse neighborhood (Simpson 0.59)
- Race & ethnicity
- White 56% Black 29% Asian 6% Two or more races 6% Hispanic / Latino 3%
- Common ancestry
- Romanian 6% Scotch-Irish 5% Italian 2%
- Foreign-born
- 12% · Canada, China
- Languages at home
- 85% English-only · Spanish 3% Other Indo-European 3% Chinese 2%
Political lean MEDSL · Cuyahoga
- 2024 margin
- Solid D (+31.5) · D 65.4% · R 33.9%
- 2008→2024 swing
- -7.4pp toward R · 2008: 38.9pp · 2024: 31.5pp
- All cycles
- 2024: D+31.5 2020: D+34.1 2016: D+35.0 2012: D+38.7 2008: D+38.9
Not yet ingested
- Civics
- —
Market trends
- HPI YoY
- ▼ -268.81%
- Current HPI
- 200.5087
- Rent YoY
- ▲ 1.15%
- Metro
- Cleveland-Elyria, OH
- State GDP YoY
- ▲ 1.98%
- F500 in state
- 48
Industry mix (Fortune 500 HQ in OH)
| Industry | F500 HQs | Revenue |
|---|---|---|
| Insurance | 3 | $145B |
|
||
| Industrial Machinery | 3 | $49B |
|
||
| Financial Services | 3 | $24B |
|
||
| Consumer Goods | 2 | $93B |
|
||
| Aerospace / Defense | 2 | $47B |
|
||
| Utilities | 2 | $33B |
|
||
Price history
+74.7% since first listed17 events — show timeline
- 2026-04-25 Pending — MLSNOW
- 2026-04-21 Listed $469,900 MLSNOW
- 2026-03-23 Listing Removed — MLSNOW
- 2026-01-12 Price Changed $499,000 MLSNOW
- 2025-11-30 Price Changed $524,900 MLSNOW
- 2025-11-05 Listed $550,000 MLSNOW
- 1997-12-18 Sold (MLS) $248,000 MLSNOW
- 1997-11-29 Listing Removed — MLSNOW
- 1997-09-19 Sold (Public Records) $240,000 Public Records
- 1997-05-29 Listed $258,000 MLSNOW
- 1993-12-13 Sold (Public Records) $212,000 Public Records
- 1993-12-13 Sold (MLS) $227,000 MLSNOW
- 1993-10-14 Listed $234,000 MLSNOW
- 1993-10-13 Listing Removed — MLSNOW
- 1993-01-13 Listed $239,900 MLSNOW
- 1992-12-01 Listing Removed — MLSNOW
- 1992-08-03 Listed $269,000 MLSNOW
Property tax history
+3.1%/yrLatest (2025): $6,518 · -0.4% YoY. Source: county tax records.
Cash-flow waterfall
monthlySold comps — $/sqft
last 12 mo · ≤1 miLoading sold comps…