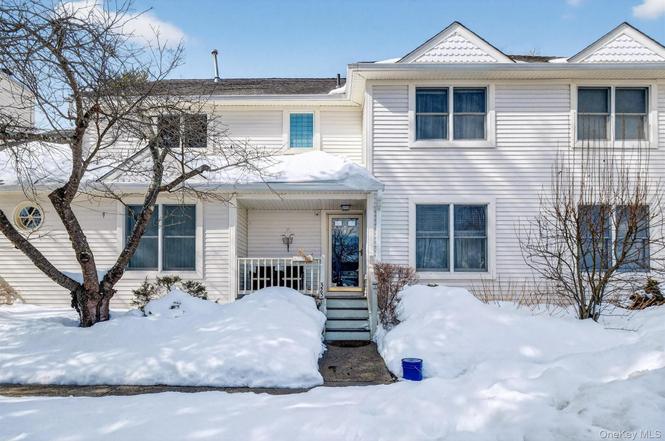
325 Cornwall Meadows Ln
Pawling, NY 12563
$399,900B
2 bd · 2.5 ba ·
2,058 sqft ·
Built 1988
· Townhouse
· Pending
· 49 DOM
Cashflow @ list (25.0% down · 7.5%)
Estimated rent
$8,000/mo
Mortgage (P&I)
−$2,097
Tax + insurance
−$1,019
HOA
−$517
Vac / Maint / Mgmt
−$1,680
Net cashflow
$2,686/mo
Annual
$32,238/yr
Cap rate
14.35%
Cash-on-cash
28.79%
DSCR
2.28
1% rule
2.00%
Cash to close
$111,972
Investor read
- This is a 2-bed/2.5-bath townhouse listed at $400k.
- At list price, monthly cash flow is $3k ($32k/yr) — positive.
- The deal already cash-flows at list — no discount required.
- Meets the 1% rule at list price ($8k rent vs $400k).
- It's been on market 49 days — a 3% lower offer ($388k) is reasonable based on typical stale-listing flexibility.
- Recommended offer: $388k (3.0% below list) — sets the bar for market timing.
- Local home prices are declining (-3.0%/yr); year-one equity from $3k of loan paydown is wiped out by about $12k of value loss. Plan a longer hold.
- Location reads 80/100 on livability (#107 in NY, #1,763 nationally) — a professional / high-income tenant draw. Strengths: crime A+, commute A+, employment A+; Watch: cost of living D, amenities F, health & safety D-.
- Carmel Central School District (suburban): math 46% / reading 63% proficiency, ranked #258 of 590 in NY (top 44%) — acceptable for families but not a draw, mixed tenant base, ~2y average lease; only 17% free/reduced lunch — higher-income household profile.
- Zoned schools: Matthew Paterson Elementary School (math 47% / reading 62%, grade C, #908 of 2,108 statewide, top 46%, 488 students, 41% FRL); George Fischer Middle School (math 21% / reading 56%, grade F, #437 of 729 statewide, top 60%, 1,130 students, 38% FRL); Carmel High School (math 97% / reading 87%, grade A+, #171 of 1,100 statewide, top 18%, 1,365 students, 36% FRL) — zoned schools average 38% FRL vs 17% district-wide (22 pts higher); higher-poverty schools than district average — tighter screening recommended.
- Watch-outs: property tax is 2.6% of price.
- Market conditions: 50 active listings in the ZIP; 1 comparable units currently listed for rent nearby; 142 units permitted in Putnam County in 2024 (75 in 5+ unit buildings).
- Putnam County population projected to shrink 3% by 2050 — rents likely to lag national; underwrite the cash flow, not the appreciation.
- Current owner paid $212k; list at $400k implies a 89% gain — meaningful room to come down on a strong offer.
- At projected returns (-3.0% appreciation + 3.0% rent growth), your $112k cash investment doubles in ~5 years — after that, you're playing with house money.
Questions for listing agent
- It's been on market 49 days. Have you received any prior offers? Is the seller open to a 3% concession, seller financing, or rate buy-down credit?
- Property tax is high relative to price — has the assessment been appealed recently, and will the sale trigger a re-assessment?
- What does the HOA fee cover, when was the last increase, and are there any pending special assessments or reserve-fund shortfalls?
- Is there a deadline driving the sale (1031 exchange, divorce, estate, relocation)? That informs how much negotiation room exists.
- Schools are A-rated — typically a magnet for longer-tenancy family renters. What's the average tenant stay here, and is there a school-zone premium baked into asking?
- What's the average days-on-market for RENTAL listings here right now (not sales)? A rising rental-DOM trend means longer vacancies and softer asking-rent achievability than the comps imply.
- What's the recent tenant-quality profile in this submarket — average credit score on applications, eviction rate, late-payment / NSF rate, and stable-employment percentage? A property-management company in the area should have these aggregated.
- How much new for-sale + rental construction is in the pipeline within 1–3 miles? Heavy new supply typically softens prices + rents 12–24 months out; constrained supply supports both.
CashFlowRE · CFR-JA53B5B5EPGTSJ
· Data 1 week ago
cashflowre.app · 2026-05-29