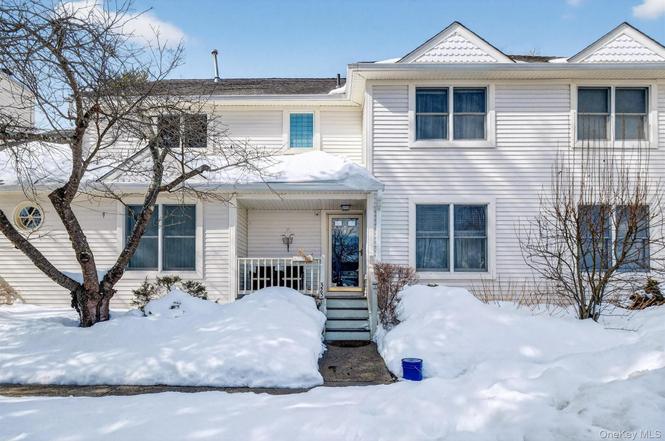
325 Cornwall Meadows Ln · Pawling, NY
Flood risk 1/10 · Minimal
- FEMA flood zone
- X (unshaded)
- Chance of flooding over 30 yrs
- 0.0%
- Est. flood insurance / yr
- $473 – $860
Fire risk 4/10 · Minor
- Est. fire insurance / yr
- $691 – $1,283
Heat risk 4/10 · Minor
- Hot days now (above 97°F)
- 7 days/yr
- Hot days in 30 yrs
- 16 days/yr
Wind risk 4/10 · Minor
- Chance of severe wind over 30 yrs
- 17.0%
Air-quality risk 3/10 · Minor
- Unhealthy air days now
- 2 days/yr
- Unhealthy air days in 30 yrs
- 3 days/yr
Risk factors via First Street. Map © Google.
Why this score? — see what drove the B grade
The composite is a weighted blend of 9 inputs, each scored 0–100. Each bar is that input's sub-score; the figure is the points it added to the 100-point composite (weight × sub-score).
- Cash flow +30.0/30.0
- 1% rule +10.0/10.0
- DSCR +10.0/10.0
- ARV discount +7.4/15.0
- Schools +5.0/10.0
- Livability +4.0/5.0
- Rent growth +2.5/5.0
- Condition / age +2.5/5.0
- Appreciation +0.0/10.0
$399,900
🖨 Deal sheet (PDF) 📄 Offer letter ✓ Due diligence
Listing remarks
325 Cornwall Meadows - Located in the highly desirable Cornwall Meadows community Light, bright, and beautifully inviting — this spacious two-bedroom townhouse offers comfort, functionality, and effortless entertaining in the heart of Patterson. Step into the sun-filled living room featuring a cozy wood-burning fireplace, perfect for chilly Hudson Valley evenings. Sliding glass doors lead to a private deck, creating seamless indoor-outdoor living — ideal for morning coffee or summer gatherings. The eat-in kitchen flows naturally into the formal dining area, offering the perfect layout for hosting dinner parties or casual get-togethers. Thoughtful design and open sightlines make
Key facts
- Private deck
- Eat in kitchen
- Private patio
Tags
Property features AI
Finance
- HOA & community: Community association with monthly fee; Monthly association fee of $517.39; Association covers common area maintenance, exterior maintenance, grounds care, and snow removal
Exterior
- Parking: Assigned parking
- Utilities: Public sewer; Cable available; Electricity available
- Home design: Townhouse; Single-family residence
- Construction: Vinyl siding construction
- Exterior features: Vinyl siding; Not waterfront
Interior
- Kitchen: Dishwasher; Range; Microwave; Refrigerator; Open kitchen layout
- Bedrooms: 5 rooms total
- Bathrooms: 2 full bathrooms; 1 half bathroom
- Interior features: Entrance foyer; Formal dining; Open floorplan; Open kitchen; Primary bathroom; Storage; Finished full walk-out basement; Partial attic
- Laundry & utility: Washer; Dryer
Neighborhood map
What this means for you Summary
Snapshot
- This is a 2-bed/2.5-bath townhouse listed at $400k.
Deal economics
- At list price, monthly cash flow is $3k ($32k/yr) — positive.
- The deal already cash-flows at list — no discount required.
- Meets the 1% rule at list price ($8k rent vs $400k).
- Recommended offer: $388k (3.0% below list) — sets the bar for market timing.
Location & tenants
- Location reads 80/100 on livability (#107 in NY, #1,763 nationally) — a professional / high-income tenant draw. Strengths: crime A+, commute A+, employment A+; Watch: cost of living D, amenities F, health & safety D-.
- Carmel Central School District (suburban): math 46% / reading 63% proficiency, ranked #258 of 590 in NY (top 44%) — acceptable for families but not a draw, mixed tenant base, ~2y average lease; only 17% free/reduced lunch — higher-income household profile.
- Zoned schools: Matthew Paterson Elementary School (math 47% / reading 62%, grade C, #908 of 2,108 statewide, top 46%, 488 students, 41% FRL); George Fischer Middle School (math 21% / reading 56%, grade F, #437 of 729 statewide, top 60%, 1,130 students, 38% FRL); Carmel High School (math 97% / reading 87%, grade A+, #171 of 1,100 statewide, top 18%, 1,365 students, 36% FRL) — zoned schools average 38% FRL vs 17% district-wide (22 pts higher); higher-poverty schools than district average — tighter screening recommended.
- Market conditions: 49 active listings in the ZIP; 1 comparable units currently listed for rent nearby; 142 units permitted in Putnam County in 2024 (75 in 5+ unit buildings).
Forward outlook
- Local home prices are declining (-3.0%/yr); year-one equity from $3k of loan paydown is wiped out by about $12k of value loss. Plan a longer hold.
- Putnam County population projected to shrink 3% by 2050 — rents likely to lag national; underwrite the cash flow, not the appreciation.
- At projected returns (-3.0% appreciation + 3.0% rent growth), your $112k cash investment doubles in ~5 years — after that, you're playing with house money.
Negotiation context
- It's been on market 49 days — a 3% lower offer ($388k) is reasonable based on typical stale-listing flexibility.
- Current owner paid $212k; list at $400k implies a 89% gain — meaningful room to come down on a strong offer.
Risks & watch-outs
- Watch-outs: property tax is 2.6% of price.
Questions for the listing agent
- It's been on market 49 days. Have you received any prior offers? Is the seller open to a 3% concession, seller financing, or rate buy-down credit?
- Property tax is high relative to price — has the assessment been appealed recently, and will the sale trigger a re-assessment?
- What does the HOA fee cover, when was the last increase, and are there any pending special assessments or reserve-fund shortfalls?
- Is there a deadline driving the sale (1031 exchange, divorce, estate, relocation)? That informs how much negotiation room exists.
- Schools are A-rated — typically a magnet for longer-tenancy family renters. What's the average tenant stay here, and is there a school-zone premium baked into asking?
- What's the average days-on-market for RENTAL listings here right now (not sales)? A rising rental-DOM trend means longer vacancies and softer asking-rent achievability than the comps imply.
- What's the recent tenant-quality profile in this submarket — average credit score on applications, eviction rate, late-payment / NSF rate, and stable-employment percentage? A property-management company in the area should have these aggregated.
- How much new for-sale + rental construction is in the pipeline within 1–3 miles? Heavy new supply typically softens prices + rents 12–24 months out; constrained supply supports both.
Investment metrics
- 1% rule
- 2.00% ✓
- Cap rate
- 14.35%
- Cash-on-cash
- 28.79%
- DSCR
- 2.28
- GRM
- 4.2
CMA / ARV
- ARV (on-the-fly)
- $399,252
- Comps found
- 12
Show comp detail 12 sales within ~0.75 mi
| Address | Dist | Beds/Ba | Sqft | Sold | Price | $/sf | Match |
|---|---|---|---|---|---|---|---|
| 217 Cornwall Meadows Ln | 0.06mi | 2/2.5 | 2,058 (0%) | 11mo | $415,000 | $202 | 88 |
| 319 Cornwall Meadows Ln | 0.02mi | 2/2.5 | 2,058 (0%) | 13mo | $345,000 | $168 | 88 |
| 316 Cornwall Meadows Ln | 0.03mi | 2/2.5 | 2,052 (-0%) | 16mo | $430,000 | $210 | 85 |
| 104 Cornwall Meadows Ln | 0.05mi | 2/2.5 | 2,058 (0%) | 21mo | $335,000 | $163 | 80 |
| 120 Cornwall Meadows Ln | 0.05mi | 2/2.5 | 2,066 (+0%) | 22mo | $410,000 | $198 | 79 |
| 422 Cornwall Meadows Ln | 0.10mi | 2/2.5 | 2,000 (-3%) | 17mo | $394,000 | $197 | 77 |
| 114 Cornwall Meadows Ln | 0.08mi | 2/3.0 | 2,162 (+5%) | 14mo | $391,050 | $181 | 74 |
| 425 Cornwall Meadows Ln | 0.09mi | 2/3.0 | 2,000 (-3%) | 21mo | $415,000 | $208 | 72 |
| 509 Covington Green Ln | 0.42mi | 2/2.5 | 1,755 (-15%) | 1mo | $340,000 | $194 | 55 |
| 102 Cornwall Mdws | 0.04mi | 1/2.5 (-1) | 1,749 (-15%) | 19mo | $335,000 | $192 | 52 |
| 601 Covington Green Ln | 0.44mi | 2/2.5 | 1,755 (-15%) | 9mo | $333,000 | $190 | 48 |
| 202 Covington Green Ln | 0.41mi | 2/2.5 | 1,755 (-15%) | 20mo | $335,000 | $191 | 40 |
Match score weights: distance 35% · size 25% · config 20% · recency 20%. Top-matched comps best support the ARV.
Projected returns pro-forma
-3.0% appreciation · 3.0% rent growth · sell at horizon
- IRR
- 23.2%
- Equity multiple
- 1.96×
- Total profit
- $106,956
- Equity at exit
- $59,626
- IRR
- 31.2%
- Equity multiple
- 3.82×
- Total profit
- $316,119
- Equity at exit
- $34,576
Cash invested: $111,972 (down + closing). Projections, not guarantees.
Landlord ↔ Tenant lean methodology
- Overall (STATE)
- 15 Strongly Tenant-Friendly
- State New York
- 15 Strongly Tenant-Friendly · D+10
- County
- — inherits STATE
- City
- — inherits STATE
ZIP-level market 12563
- Home prices YoY
- -12.7%
- Active inventory
- 49
- Price-to-rent
- 4.2×
Monthly cashflow live
- Estimated rent
- $8,000 medium interval (Pro) →
- Mortgage (P&I)
- −$2,097
- Tax from tax record
- −$853 /mo · $10,234/yr
- Insurance
- −$167
- HOA
- −$517
- Vacancy / Maint / Mgmt
- −$1,680
- Net cashflow
- $2,686
Break-even live
Sensitivity live
| Price | -10% $2,913 | -5% $2,800 | +0% $2,686 | +5% $2,573 | +10% $2,460 |
|---|---|---|---|---|---|
| Rent | -10% $2,054 | -5% $2,370 | +0% $2,686 | +5% $3,002 | +10% $3,318 |
| Rate | -1.0pp $2,888 | -0.5pp $2,788 | base $2,686 | +0.5pp $2,583 | +1.0pp $2,477 |
UW: 25.0% down · 7.5% · 30yr · 1.5% tax · 5.0% vac · 8.0% maint · 8.0% mgmt
Financing live
Cash to close
- Down payment
- $99,975
- Closing costs
- $11,997
- Reserves months
- —
- Total cash needed
- —
Loan-product check · same deal, 3 products live
Conventional
25% down · 7.5% · 30yr
- Down + closing
- —
- Monthly P&I
- —
- Monthly cashflow
- —
- DSCR
- —
- Eligible?
- —
Personal DTI + credit; lowest rate.
DSCR
20% down · 8.5% · 30yr
- Down + closing
- —
- Monthly P&I
- —
- Monthly cashflow
- —
- DSCR
- —
- Eligible?
- —
No personal income docs; deal must DSCR.
Hard money
10% down · 12.0% · 12mo
- Down + closing
- —
- Monthly P&I
- —
- Monthly cashflow
- —
- DSCR
- —
- Eligible?
- —
Short-term bridge; refi at stabilization.
Rent comps 1 comps
| Address | Beds | Baths | Sqft | Rent | $/sqft | DOM | Units | Dist |
|---|---|---|---|---|---|---|---|---|
| 90 Cushman Rd Patterson, NY | 3.0 | 2.0 | 2286 | $8,000 | $3.50 | 13d | 1 | 1.40mi |
HOA detail
- Monthly dues
- $517 · $6,204/yr
Listing history 5 events
-
2026-04-20status Pending
-
2026-03-02$399,900 Active
-
2015-10-23soldstatus $212,000
-
2001-10-01soldstatus $215,000
-
1993-07-09soldstatus $183,000
ⓘ Source: listings_history table (triggers on properties + properties_extension) + one-shot
backfill from property_details.listing_events for pre-trigger history.
Tax reassessment forecast NY · Partial reset (capped growth)
- Current annual tax
- $10,234 · $853/mo
- Projected year-2 tax
- $10,234 · $853/mo
- Expected delta
- $0/yr ($0/mo · 0.0%)
ⓘ Screening estimate from a state-policy table — verify with the county assessor before closing.
Climate risk First Street
- Flood 1/10 Low FEMA zone X (unshaded) · 0% chance over 30 yrs
- Wildfire 4/10 Moderate
- Heat 4/10 Moderate 7 d/yr ≥97°F today · 16 d/yr by 30 yrs out
- Wind 4/10 Moderate 17% chance of damaging wind over 30 yrs
- Air quality 3/10 Moderate 2 unhealthy d/yr today · 3 by 30 yrs out
Nearby sold comps map
Loading sold comps map…
Walkable amenities ~0.75 mi
Loading nearby amenities…
Taxation est. · year 1
- Rental income
- $96,000
- − Mortgage interest
- −$22,401
- − Property taxes
- −$10,234
- − Insurance
- −$2,000
- − Repairs & maintenance
- −$7,680
- − Management
- −$7,680
- − HOA
- −$6,204
- − Depreciation
- −$11,633
- Taxable income
- $28,169
- Est. tax owed @ 24.0%
- −$6,761
- After-tax cash flow
- $25,477/yr
For passive investors: Depreciation is non-cash, so a rental often shows a tax loss while cash-flowing — sheltering income. Rental losses are passive: they offset passive income freely, and up to $25,000/yr can offset ordinary (W-2) income if you actively participate and your MAGI is under $100k (phasing out to $0 by $150k); unused losses carry forward. On sale, claimed depreciation is recaptured at up to 25%, and gains may owe capital-gains tax (a 1031 exchange can defer both). Figures are a year-1 estimate at your 24.0% rate — not tax advice; consult a CPA.
Schools (NCES district)
- District
- Carmel Central School District
- NCES district ID
- 3606570
- Math proficiency
- 46% ▼ -15.00%
- Reading proficiency
- 63% ▲ 11.00%
- Median HH income
- $87,665
- Composite
- 50.05/100
- National rank
- #1914
- State rank
- #258 of 590 in NY
Livability — Pawling
- Score
- 80/100
- State rank
- #107
- US rank
- #1763
Category grades
Schools grade is shown separately in the Schools card above.
Census & demographics
- Population (ZIP)
- 7,456
Population outlook (Putnam County) Hauer SSP2
- Today (2025)
- 99,705 people
- By 2030
- 99,650 · -0.1%
- By 2040
- 98,641 · -1.1%
- By 2050
- 96,348 · -3.4%
- By 2075
- 94,412 · -5.3%
- By 2100
- 88,728 · -11.0%
Race, ethnicity, and origin ACS 2023
- Neighborhood character
- Predominantly White (69%)
- Race & ethnicity
- White 69% Hispanic / Latino 17% Black 9% Two or more races 6% Asian 2%
- Hispanic origin (detail)
- Mexican 4% Puerto Rican 3% Cuban 1% Dominican 3%
- Common ancestry
- Romanian 5% Portuguese 2% Slovak 1%
- Foreign-born
- 14% · Canada, South Korea, Dominican Republic
- Languages at home
- 79% English-only · Spanish 12% Other Indo-European 3% Russian/Polish/Slavic 2%
Political lean MEDSL · Putnam
- 2024 margin
- R (+13.7) · D 43.2% · R 56.8%
- 2008→2024 swing
- -6.2pp toward R · 2008: -7.5pp · 2024: -13.7pp
- All cycles
- 2024: R+13.7 2020: R+7.9 2016: R+17.8 2012: R+11.2 2008: R+7.5
Not yet ingested
- Civics
- —
Market trends
- HPI YoY
- ▼ -36.07%
- Current HPI
- 247.1582
- Rent YoY
- —
- Metro
- —
- State GDP YoY
- ▲ 2.60%
- F500 in state
- 92
Industry mix (Fortune 500 HQ in NY)
| Industry | F500 HQs | Revenue |
|---|---|---|
| Financial Services | 10 | $950B |
|
||
| Consumer Goods | 9 | $162B |
|
||
| Insurance | 4 | $225B |
|
||
| Telecommunications | 2 | $144B |
|
||
| Pharmaceuticals | 2 | $112B |
|
||
| Media / Entertainment | 2 | $69B |
|
||
Price history
+118.5% since first listed5 events — show timeline
- 2026-04-20 Pending — OneKey® MLS as Distributed by MLS Grid
- 2026-03-02 Listed $399,900 OneKey® MLS as Distributed by MLS Grid
- 2015-10-23 Sold (Public Records) $212,000 Public Records
- 2001-10-01 Sold (Public Records) $215,000 Public Records
- 1993-07-09 Sold (Public Records) $183,000 Public Records
Property tax history
+6.1%/yrLatest (2025): $10,234 · +7.2% YoY. Source: county tax records.
Cash-flow waterfall
monthlySold comps — $/sqft
last 12 mo · ≤1 miLoading sold comps…