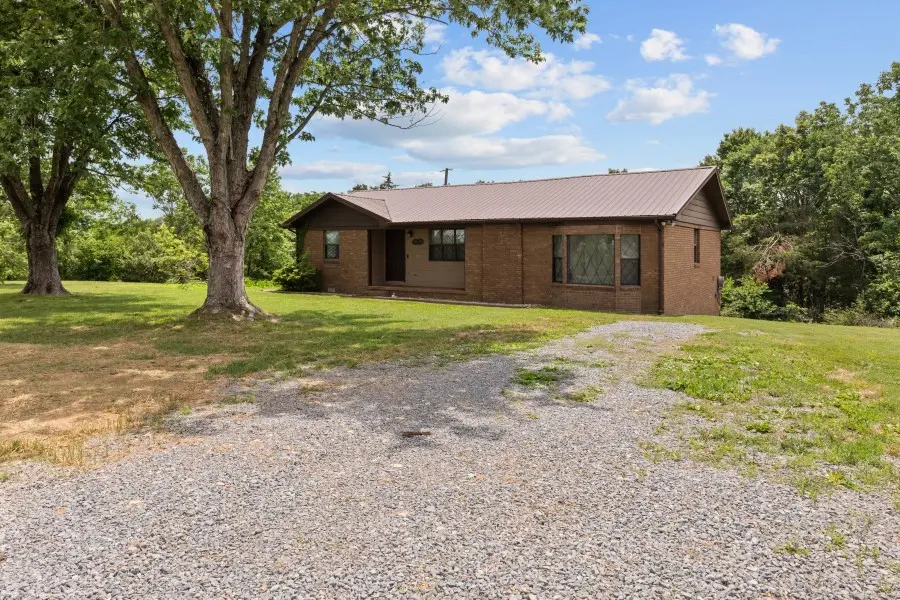
4169 Bledsoe St
Westmoreland, TN 37186
$299,900D
3 bd · 2.0 ba ·
1,390 sqft ·
Built 1980
· SingleFamily
· Active
· 16 DOM
Cashflow @ list (25.0% down · 7.5%)
Estimated rent
$2,195/mo
Mortgage (P&I)
−$1,573
Tax + insurance
−$251
HOA
−$0
Vac / Maint / Mgmt
−$461
Net cashflow
$-90/mo
Annual
$-1,074/yr
Cap rate
5.93%
Cash-on-cash
-1.28%
DSCR
0.94
1% rule
0.73%
Cash to close
$83,972
Investor read
- This is a 3-bed/2.0-bath single-family listed at $300k.
- At list price, monthly cash flow is $-90 ($-1k/yr) — negative.
- To cash-flow at today's rent, offer at most $284k (5.3% below list).
- To meet the 1% rule (rent ≥ 1% of price), the offer needs to be $220k (26.8% below list).
- It's been on market 16 days — a 2% lower offer ($295k) is reasonable based on typical stale-listing flexibility.
- Recommended offer: $220k (26.8% below list) — sets the bar for 1% rule.
- Local home prices are declining (-3.0%/yr); year-one equity from $2k of loan paydown is wiped out by about $9k of value loss. Plan a longer hold.
- Location reads 68/100 on livability (#91 in TN) — a middle-class / working-renter tenant base. Strengths: crime A+, cost of living A+, housing A+; Watch: amenities F, commute F, employment D-.
- Sumner County (suburban): math 44% / reading 39% proficiency, ranked #12 of 139 in TN (top 9%) — families likely to look elsewhere, expect single-tenant / working-renter base with shorter leases.
- Zoned schools: Westmoreland Elementary (math 41% / reading 33%, grade F, #272 of 952 statewide, top 31%, 525 students, 0% FRL); Westmoreland Middle School (math 39% / reading 28%, grade F, #73 of 333 statewide, top 23%, 430 students, 0% FRL); Westmoreland High School (math 27% / reading 37%, grade F, #56 of 332 statewide, top 20%, 526 students, 0% FRL) — zoned schools average 0% FRL vs 34% district-wide (34 pts lower); this property's tenant base skews higher-income than the district average.
- Market conditions: 145 active listings in the ZIP; 1 comparable units currently listed for rent nearby; 1,748 units permitted in Sumner County in 2024 (124 in 5+ unit buildings).
- Sumner County population projected at +35% by 2050 — long-run rental-demand tailwind backs the buy-and-hold thesis.
- 3 sale attempts since 7y ago with the ask held roughly flat each time — persistent listings suggest the price (not the market) is what's stuck; bring a comps-based counter.
- Climate carrying-cost: extreme-heat days projected 7→20/yr by 2055 (HVAC capex compounding) — expect insurance premiums to compound above CPI over the hold.
- Cap rate 5.9% vs local median 4.3% in Westmoreland — top-decile yield for the area; either an underpriced asset or a hidden risk that comps aren't pricing in. Stress-test before assuming the spread holds.
Questions for listing agent
- What do current leases actually rent for vs. the listed asking? Can we see a recent rent roll and the last 12 months of T-12 income?
- Is there a deadline driving the sale (1031 exchange, divorce, estate, relocation)? That informs how much negotiation room exists.
- Schools are D-rated, which usually means shorter tenancies and higher turnover. Who's the typical renter profile here, and what's been the actual vacancy rate?
- The area grade is low — what's the realistic commute time and amenity access for the typical tenant pool here? Any planned neighborhood developments (good or bad) we should know about?
- What's the average days-on-market for RENTAL listings here right now (not sales)? A rising rental-DOM trend means longer vacancies and softer asking-rent achievability than the comps imply.
- What's the recent tenant-quality profile in this submarket — average credit score on applications, eviction rate, late-payment / NSF rate, and stable-employment percentage? A property-management company in the area should have these aggregated.
- How much new for-sale + rental construction is in the pipeline within 1–3 miles? Heavy new supply typically softens prices + rents 12–24 months out; constrained supply supports both.
CashFlowRE · CFR-JA7A9N5NS5YV08
· Data 1 day ago
cashflowre.app · 2026-05-29