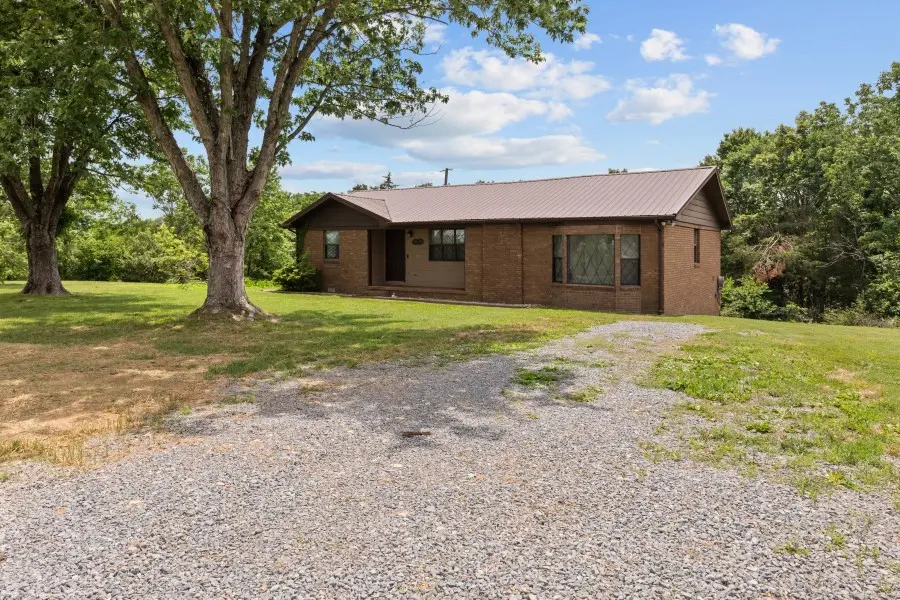
4169 Bledsoe St · Westmoreland, TN
Flood risk 1/10 · Minimal
- FEMA flood zone
- X (unshaded)
- Chance of flooding over 30 yrs
- 0.0%
- Est. flood insurance / yr
- $507 – $1,088
Fire risk 4/10 · Minor
- Est. fire insurance / yr
- $949 – $1,763
Heat risk 5/10 · Moderate
- Hot days now (above 106°F)
- 7 days/yr
- Hot days in 30 yrs
- 20 days/yr
Wind risk 3/10 · Minor
- Chance of severe wind over 30 yrs
- 7.0%
Air-quality risk 3/10 · Minor
- Unhealthy air days now
- 2 days/yr
- Unhealthy air days in 30 yrs
- 4 days/yr
Risk factors via First Street. Map © Google.
Why this score? — see what drove the D grade
The composite is a weighted blend of 9 inputs, each scored 0–100. Each bar is that input's sub-score; the figure is the points it added to the 100-point composite (weight × sub-score).
- Cash flow +11.7/30.0
- ARV discount +10.5/15.0
- Schools +3.6/10.0
- DSCR +3.4/10.0
- Livability +3.4/5.0
- Appreciation +2.7/10.0
- Rent growth +2.5/5.0
- Condition / age +2.5/5.0
- 1% rule +2.3/10.0
$299,900
🖨 Deal sheet (PDF) 📄 Offer letter ✓ Due diligence
Listing remarks MLS
MOTIVATED SELLERS! This 3 bed, 2 bath brick home offers fresh updates including paint, new HVAC. and flooring. Enjoy cozy nights by the fireplace and peaceful country living on almost 2 acres. Spacious, move-in ready, and just minutes from town—don’t miss this one!
Key facts
- Large lot
- 1.9 acre lot
- Built 1980
Tags
Property features AI
Finance
- Financial info: Annual tax amount listed (amount withheld from output per instructions)
Exterior
- Parking: No covered parking listed; No total parking spaces listed
- Utilities: Public water available; Septic tank; Water available
- Home design: Single-family residence; One-story; Brick construction
- Construction: Brick exterior; Existing (previously built)
- Exterior features: Approximately 1.9-acre lot
Interior
- Kitchen: Cooktop, Range, Dishwasher, Microwave, Refrigerator
- Bedrooms: Three bedrooms (all on the main level)
- Flooring: Laminate flooring
- Bathrooms: Two full bathrooms
- Heating & cooling: Central heating; Central air conditioning
- Interior features: Cooktop, Range, Dishwasher, Microwave, Refrigerator; Laminate flooring; Crawl space basement
Neighborhood map
What this means for you Summary
Snapshot
- This is a 3-bed/2.0-bath single-family listed at $300k.
Deal economics
- At list price, monthly cash flow is $-90 ($-1k/yr) — negative.
- To cash-flow at today's rent, offer at most $284k (5.3% below list).
- To meet the 1% rule (rent ≥ 1% of price), the offer needs to be $220k (26.8% below list).
- Recommended offer: $220k (26.8% below list) — sets the bar for 1% rule.
- Cap rate 5.9% vs local median 4.3% in Westmoreland — top-decile yield for the area; either an underpriced asset or a hidden risk that comps aren't pricing in. Stress-test before assuming the spread holds.
Location & tenants
- Location reads 68/100 on livability (#91 in TN) — a middle-class / working-renter tenant base. Strengths: crime A+, cost of living A+, housing A+; Watch: amenities F, commute F, employment D-.
- Sumner County (suburban): math 44% / reading 39% proficiency, ranked #12 of 139 in TN (top 9%) — families likely to look elsewhere, expect single-tenant / working-renter base with shorter leases.
- Zoned schools: Westmoreland Elementary (math 41% / reading 33%, grade F, #272 of 952 statewide, top 31%, 525 students, 0% FRL); Westmoreland Middle School (math 39% / reading 28%, grade F, #73 of 333 statewide, top 23%, 430 students, 0% FRL); Westmoreland High School (math 27% / reading 37%, grade F, #56 of 332 statewide, top 20%, 526 students, 0% FRL) — zoned schools average 0% FRL vs 34% district-wide (34 pts lower); this property's tenant base skews higher-income than the district average.
- Market conditions: 145 active listings in the ZIP; 1 comparable units currently listed for rent nearby; 1,748 units permitted in Sumner County in 2024 (124 in 5+ unit buildings).
Forward outlook
- Local home prices are declining (-3.0%/yr); year-one equity from $2k of loan paydown is wiped out by about $9k of value loss. Plan a longer hold.
- Sumner County population projected at +35% by 2050 — long-run rental-demand tailwind backs the buy-and-hold thesis.
Negotiation context
- It's been on market 16 days — a 2% lower offer ($295k) is reasonable based on typical stale-listing flexibility.
- 3 sale attempts since 7y ago with the ask held roughly flat each time — persistent listings suggest the price (not the market) is what's stuck; bring a comps-based counter.
Risks & watch-outs
- Climate carrying-cost: extreme-heat days projected 7→20/yr by 2055 (HVAC capex compounding) — expect insurance premiums to compound above CPI over the hold.
Questions for the listing agent
- What do current leases actually rent for vs. the listed asking? Can we see a recent rent roll and the last 12 months of T-12 income?
- Is there a deadline driving the sale (1031 exchange, divorce, estate, relocation)? That informs how much negotiation room exists.
- Schools are D-rated, which usually means shorter tenancies and higher turnover. Who's the typical renter profile here, and what's been the actual vacancy rate?
- The area grade is low — what's the realistic commute time and amenity access for the typical tenant pool here? Any planned neighborhood developments (good or bad) we should know about?
- What's the average days-on-market for RENTAL listings here right now (not sales)? A rising rental-DOM trend means longer vacancies and softer asking-rent achievability than the comps imply.
- What's the recent tenant-quality profile in this submarket — average credit score on applications, eviction rate, late-payment / NSF rate, and stable-employment percentage? A property-management company in the area should have these aggregated.
- How much new for-sale + rental construction is in the pipeline within 1–3 miles? Heavy new supply typically softens prices + rents 12–24 months out; constrained supply supports both.
Investment metrics
- 1% rule
- 0.73% ✗
- Cap rate
- 5.93%
- Cash-on-cash
- -1.28%
- DSCR
- 0.94
- GRM
- 11.4
CMA / ARV
- ARV (on-the-fly)
- $321,090
- Comps found
- 12
Show comp detail 12 sales within ~0.75 mi
| Address | Dist | Beds/Ba | Sqft | Sold | Price | $/sf | Match |
|---|---|---|---|---|---|---|---|
| 450 Robins Trl | 0.26mi | 3/2.0 | 1,368 (-2%) | 12mo | $320,000 | $234 | 75 |
| 103 Hummingbird Hill Ct | 0.21mi | 3/2.0 | 1,361 (-2%) | 21mo | $312,000 | $229 | 69 |
| 1985 Stevens Dr | 0.54mi | 3/2.0 | 1,386 (-0%) | 10mo | $320,000 | $231 | 66 |
| 246 Clyde Wix Rd | 0.46mi | 3/2.0 | 1,374 (-1%) | 13mo | $339,900 | $247 | 66 |
| 1981 Stevens Dr | 0.53mi | 3/2.0 | 1,416 (+2%) | 10mo | $330,000 | $233 | 64 |
| 250 Clyde Wix Rd | 0.48mi | 3/2.0 | 1,374 (-1%) | 14mo | $336,000 | $245 | 64 |
| 2131 Lambert Dr | 0.65mi | 3/2.0 | 1,362 (-2%) | 7mo | $292,000 | $214 | 61 |
| 6102 Austin Peay Hwy | 0.56mi | 3/2.0 | 1,500 (+8%) | 10mo | $349,872 | $233 | 52 |
| 2119 Stevens Dr | 0.70mi | 3/1.0 | 1,304 (-6%) | 1mo | $180,000 | $138 | 52 |
| 6009 Austin Peay Hwy | 0.57mi | 2/1.0 (-1) | 1,431 (+3%) | 12mo | $229,500 | $160 | 50 |
| 2209 Lambert Dr | 0.71mi | 3/2.0 | 1,497 (+8%) | 13mo | $334,500 | $223 | 43 |
| 2006 Stevens Dr | 0.59mi | 3/1.0 | 1,296 (-7%) | 21mo | $240,800 | $186 | 40 |
Match score weights: distance 35% · size 25% · config 20% · recency 20%. Top-matched comps best support the ARV.
Projected returns pro-forma
-3.0% appreciation · 3.0% rent growth · sell at horizon
- IRR
- -18.5%
- Equity multiple
- 0.35×
- Total profit
- $-54,419
- Equity at exit
- $44,716
- IRR
- -10.9%
- Equity multiple
- 0.34×
- Total profit
- $-55,217
- Equity at exit
- $25,930
Cash invested: $83,972 (down + closing). Projections, not guarantees.
Landlord ↔ Tenant lean methodology
- Overall (STATE)
- 87 Strongly Landlord-Friendly
- State Tennessee
- 87 Strongly Landlord-Friendly · R+13
- County
- — inherits STATE
- City
- — inherits STATE
ZIP-level market 37186
- Home prices YoY
- -1.4%
- Active inventory
- 145
- Price-to-rent
- 11.4×
Monthly cashflow live
- Estimated rent
- $2,195 medium interval (Pro) →
- Mortgage (P&I)
- −$1,573
- Tax from tax record
- −$126 /mo · $1,511/yr
- Insurance
- −$125
- HOA
- −$0
- Vacancy / Maint / Mgmt
- −$461
- Net cashflow
- $-90
Break-even live
Sensitivity live
| Price | -10% $80 | -5% $-5 | +0% $-90 | +5% $-174 | +10% $-259 |
|---|---|---|---|---|---|
| Rent | -10% $-263 | -5% $-176 | +0% $-90 | +5% $-3 | +10% $84 |
| Rate | -1.0pp $61 | -0.5pp $-13 | base $-90 | +0.5pp $-167 | +1.0pp $-246 |
UW: 25.0% down · 7.5% · 30yr · 1.5% tax · 5.0% vac · 8.0% maint · 8.0% mgmt
Financing live
Cash to close
- Down payment
- $74,975
- Closing costs
- $8,997
- Reserves months
- —
- Total cash needed
- —
Loan-product check · same deal, 3 products live
Conventional
25% down · 7.5% · 30yr
- Down + closing
- —
- Monthly P&I
- —
- Monthly cashflow
- —
- DSCR
- —
- Eligible?
- —
Personal DTI + credit; lowest rate.
DSCR
20% down · 8.5% · 30yr
- Down + closing
- —
- Monthly P&I
- —
- Monthly cashflow
- —
- DSCR
- —
- Eligible?
- —
No personal income docs; deal must DSCR.
Hard money
10% down · 12.0% · 12mo
- Down + closing
- —
- Monthly P&I
- —
- Monthly cashflow
- —
- DSCR
- —
- Eligible?
- —
Short-term bridge; refi at stabilization.
Rent comps 1 comps
| Address | Beds | Baths | Sqft | Rent | $/sqft | DOM | Units | Dist |
|---|---|---|---|---|---|---|---|---|
| 2199 Fincher Dr Westmoreland, TN | 3.0 | 2.0 | 1532 | $2,195 | $1.43 | 0d | 1 | 0.68mi |
Listing history 11 events
-
2026-06-21days on market $299,900 Active 16 DOM
-
2026-06-18days on market $299,900 Active 13 DOM
-
2026-06-17days on market $299,900 Active 12 DOM
-
2026-06-16days on market $299,900 Active 11 DOM
-
2026-06-15days on market $299,900 Active 10 DOM
-
2026-06-13days on market $299,900 Active 8 DOM
-
2026-06-13days on market $299,900 Active 7 DOM
-
2026-06-09days on market $299,900 Active 4 DOM
-
2026-06-08days on market $299,900 Active 3 DOM
-
2026-06-07remarks 323-char remark
-
2026-06-07$299,900 Active 2 DOM
ⓘ Source: listings_history table (triggers on properties + properties_extension) + one-shot
backfill from property_details.listing_events for pre-trigger history.
Tax reassessment forecast TN · Resets to sale price
- Current annual tax
- $1,511 · $126/mo
- Projected year-2 tax
- $2,129 · $177/mo
- Expected delta
- +$618/yr (+$52/mo · 40.9%)
ⓘ Screening estimate from a state-policy table — verify with the county assessor before closing.
Climate risk First Street
- Flood 1/10 Low FEMA zone X (unshaded) · 0% chance over 30 yrs
- Wildfire 4/10 Moderate
- Heat 5/10 Major 7 d/yr ≥106°F today · 20 d/yr by 30 yrs out
- Wind 3/10 Moderate 7% chance of damaging wind over 30 yrs
- Air quality 3/10 Moderate 2 unhealthy d/yr today · 4 by 30 yrs out
Nearby sold comps map
Loading sold comps map…
Walkable amenities ~0.75 mi
Loading nearby amenities…
Taxation est. · year 1
- Rental income
- $26,340
- − Mortgage interest
- −$16,799
- − Property taxes
- −$1,511
- − Insurance
- −$1,500
- − Repairs & maintenance
- −$2,107
- − Management
- −$2,107
- − Depreciation
- −$8,724
- Taxable loss
- −$6,408
- Est. tax savings @ 24.0%
- +$1,538
- After-tax cash flow
- $464/yr
For passive investors: Depreciation is non-cash, so a rental often shows a tax loss while cash-flowing — sheltering income. Rental losses are passive: they offset passive income freely, and up to $25,000/yr can offset ordinary (W-2) income if you actively participate and your MAGI is under $100k (phasing out to $0 by $150k); unused losses carry forward. On sale, claimed depreciation is recaptured at up to 25%, and gains may owe capital-gains tax (a 1031 exchange can defer both). Figures are a year-1 estimate at your 24.0% rate — not tax advice; consult a CPA.
Schools (NCES district)
- District
- Sumner County
- NCES district ID
- 4704020
- Math proficiency
- 44% ▼ -11.00%
- Reading proficiency
- 39% ▼ -5.00%
- Median HH income
- $56,998
- Composite
- 36.44/100
- National rank
- #4667
- State rank
- #12 of 139 in TN
Livability — Westmoreland
- Score
- 68/100
- State rank
- #91
- US rank
- #9706
Category grades
Schools grade is shown separately in the Schools card above.
Census & demographics
- Census place
- Westmoreland, TN
- Population (ZIP)
- 10,644
Population outlook (Sumner County) Hauer SSP2
- Today (2025)
- 208,284 people
- By 2030
- 223,902 · +7.5%
- By 2040
- 253,892 · +21.9%
- By 2050
- 281,199 · +35.0%
- By 2075
- 344,866 · +65.6%
- By 2100
- 384,369 · +84.5%
Race, ethnicity, and origin ACS 2023
- Neighborhood character
- Predominantly White (92%)
- Race & ethnicity
- White 92% Two or more races 5% Asian 1% Hispanic / Latino 1%
- Common ancestry
- Slovak 2% Lithuanian 1% Serbian 1%
- Foreign-born
- 1%
- Languages at home
- 98% English-only · Other Indo-European 1% Spanish 1%
Political lean MEDSL · Sumner
- 2024 margin
- Solid R (+41.8) · D 28.5% · R 70.3% · Other 1.1%
- 2008→2024 swing
- -6.9pp toward R · 2008: -34.9pp · 2024: -41.8pp
- All cycles
- 2024: R+41.8 2020: R+38.6 2016: R+45.0 2012: R+42.0 2008: R+34.9
Not yet ingested
- Civics
- —
Market trends
- HPI YoY
- ▼ -4.60%
- Current HPI
- 336.4711
- Rent YoY
- —
- Metro
- —
- State GDP YoY
- ▲ 2.78%
- F500 in state
- 22
Industry mix (Fortune 500 HQ in TN)
| Industry | F500 HQs | Revenue |
|---|---|---|
| Healthcare | 3 | $91B |
|
||
| Retail | 3 | $72B |
|
||
| Transportation / Logistics | 1 | $88B |
|
||
| Paper / Packaging | 1 | $19B |
|
||
| Insurance | 1 | $13B |
|
||
| Energy | 1 | $12B |
|
||
Price history
+50.0% since first listed7 events — show timeline
- 2026-06-05 Listed $299,900 REALTRACS as Distributed by MLS Grid
- 2025-12-31 Listing Removed — REALTRACS as Distributed by MLS Grid
- 2025-07-10 Price Changed $299,900 REALTRACS as Distributed by MLS Grid
- 2025-06-24 Price Changed $304,900 REALTRACS as Distributed by MLS Grid
- 2025-06-04 Listed $309,900 REALTRACS as Distributed by MLS Grid
- 2020-01-15 Listing Removed — REALTRACS as Distributed by MLS Grid
- 2019-10-13 Listed $199,900 REALTRACS as Distributed by MLS Grid
Property tax history
+21.0%/yrLatest (2025): $1,511 · +474.5% YoY. Source: county tax records.
Cash-flow waterfall
monthlySold comps — $/sqft
last 12 mo · ≤1 miLoading sold comps…