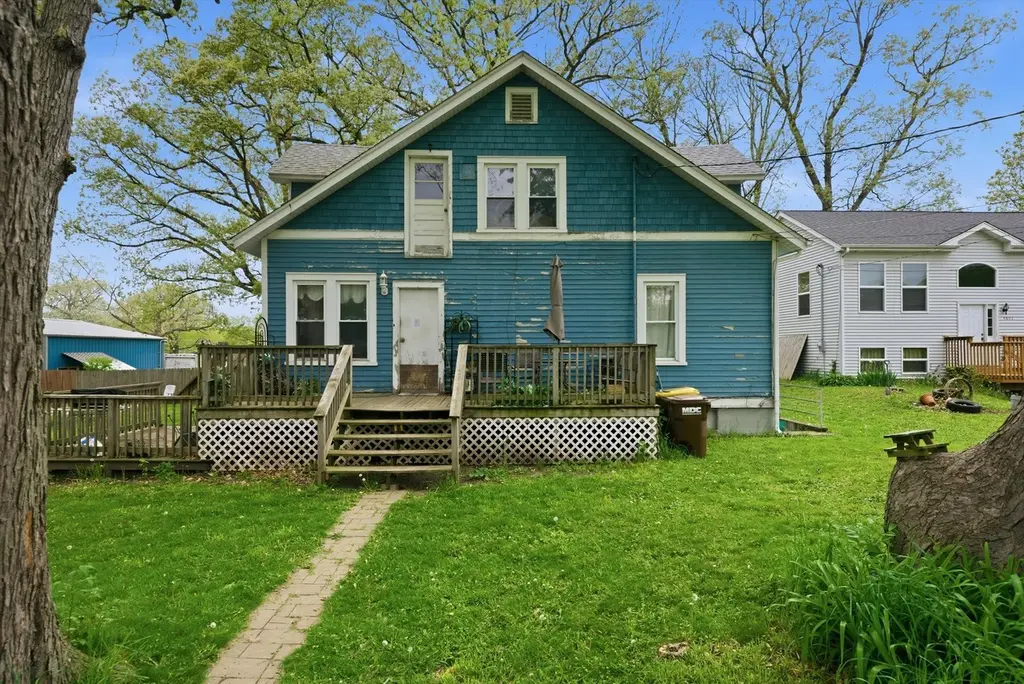
4823 S Little Dr
Island Lake, IL 60051
$249,999C+
6 bd · 2.5 ba ·
2,148 sqft ·
Built 1916
· SingleFamily
· Pending
· 24 DOM
Cashflow @ list (25.0% down · 7.5%)
Estimated rent
$2,480/mo
Mortgage (P&I)
−$1,311
Tax + insurance
−$503
HOA
−$21
Vac / Maint / Mgmt
−$521
Net cashflow
$125/mo
Annual
$1,494/yr
Cap rate
6.89%
Cash-on-cash
2.13%
DSCR
1.09
1% rule
0.99%
Cash to close
$70,000
Investor read
- This is a 6-bed/2.5-bath single-family listed at $250k.
- At list price, monthly cash flow is $125 ($1k/yr) — positive.
- The deal already cash-flows at list — no discount required.
- To meet the 1% rule (rent ≥ 1% of price), the offer needs to be $248k (0.8% below list).
- It's been on market 24 days — a 2% lower offer ($246k) is reasonable based on typical stale-listing flexibility.
- Recommended offer: $246k (1.5% below list) — sets the bar for market timing.
- In year one you build about $27k of equity ($2k loan paydown + $25k appreciation (10.0% local appreciation)).
- Location reads 81/100 on livability (#84 in IL, #1,369 nationally) — a professional / high-income tenant draw. Strengths: crime A+, employment A+, housing A+; Watch: amenities F, commute F.
- Wauconda CUSD 118 (suburban): math 22% / reading 29% proficiency, ranked #267 of 620 in IL (top 43%) — low school quality limits family demand, transient renter base, plan for 1-2y turnover.
- Zoned schools: Cotton Creek School (math 17% / reading 27%, grade F, #940 of 2,056 statewide, top 49%, 576 students, 0% FRL); Matthews Middle School (math 16% / reading 26%, grade F, #405 of 665 statewide, top 61%, 510 students, 0% FRL); Wauconda High School (math 25% / reading 33%, grade F, #210 of 693 statewide, top 30%, 1,460 students, 0% FRL) — zoned schools average 0% FRL vs 25% district-wide (25 pts lower); this property's tenant base skews higher-income than the district average.
- Watch-outs: built in 1916 — expect roof / HVAC / electrical / plumbing capex.
- Market conditions: 152 active listings in the ZIP; 1,595 units permitted in McHenry County in 2024 (485 in 5+ unit buildings).
- McHenry County population projected at -12% by 2050 — secular population decline; favor cash flow + early exit over multi-decade hold.
- 4 sale attempts since 8y ago with the ask held roughly flat each time — persistent listings suggest the price (not the market) is what's stuck; bring a comps-based counter.
- Current owner paid $72k; list at $250k implies a 247% gain — meaningful room to come down on a strong offer.
- At projected returns (10.0% appreciation + 3.0% rent growth), your $70k cash investment doubles in ~3 years — after that, you're playing with house money.
- By year 2, paydown + projected appreciation supports a ~$43k cash-out refi (75% LTV) — recoverable capital for the next deal without selling this one.
- Cap rate 6.9% vs local median 4.5% in Island Lake — top-decile yield for the area; either an underpriced asset or a hidden risk that comps aren't pricing in. Stress-test before assuming the spread holds.
Questions for listing agent
- Built in 1916 — when were the roof, HVAC, electrical panel, plumbing, and water heater last replaced?
- What does the HOA fee cover, when was the last increase, and are there any pending special assessments or reserve-fund shortfalls?
- Is there a deadline driving the sale (1031 exchange, divorce, estate, relocation)? That informs how much negotiation room exists.
- What's the average days-on-market for RENTAL listings here right now (not sales)? A rising rental-DOM trend means longer vacancies and softer asking-rent achievability than the comps imply.
- What's the recent tenant-quality profile in this submarket — average credit score on applications, eviction rate, late-payment / NSF rate, and stable-employment percentage? A property-management company in the area should have these aggregated.
- How much new for-sale + rental construction is in the pipeline within 1–3 miles? Heavy new supply typically softens prices + rents 12–24 months out; constrained supply supports both.
CashFlowRE · CFR-JA9HTQ86772KGY
· Data 1 day ago
cashflowre.app · 2026-05-29