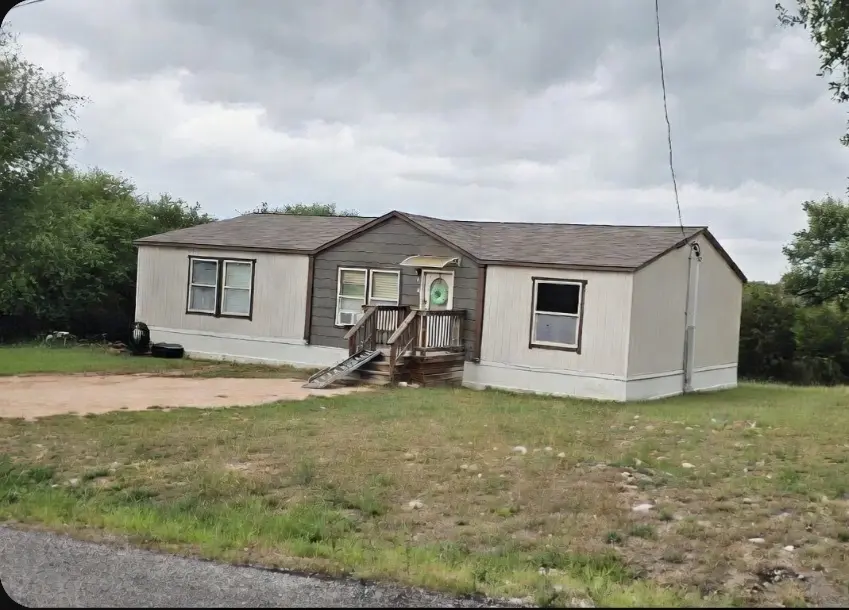
141 Brianna Cir
Johnson City, TX 78636
$209,000C
4 bd · 2.0 ba ·
1,664 sqft ·
Built 2019
· Manufactured
· Pending
· 18 DOM
Cashflow @ list (25.0% down · 7.5%)
Estimated rent
$2,309/mo
Mortgage (P&I)
−$1,096
Tax + insurance
−$358
HOA
−$0
Vac / Maint / Mgmt
−$485
Net cashflow
$370/mo
Annual
$4,442/yr
Cap rate
8.42%
Cash-on-cash
7.59%
DSCR
1.34
1% rule
1.10%
Cash to close
$58,520
Investor read
- This is a 4-bed/2.0-bath manufactured listed at $209k.
- At list price, monthly cash flow is $370 ($4k/yr) — positive.
- The deal already cash-flows at list — no discount required.
- Meets the 1% rule at list price ($2k rent vs $209k).
- It's been on market 18 days — a 2% lower offer ($206k) is reasonable based on typical stale-listing flexibility.
- Recommended offer: $206k (1.5% below list) — sets the bar for market timing.
- Local home prices are declining (-3.0%/yr); year-one equity from $1k of loan paydown is wiped out by about $6k of value loss. Plan a longer hold.
- Location reads 75/100 on livability (#131 in TX, #3,919 nationally) — a middle-class / working-renter tenant base. Strengths: crime A+, cost of living A+, housing A+; Watch: amenities F, commute F, employment D-.
- Johnson City ISD (rural): math 51% / reading 51% proficiency, ranked #141 of 826 in TX (top 17%) — acceptable for families but not a draw, mixed tenant base, ~2y average lease.
- Zoned schools: Lyndon B Johnson El (math 47% / reading 42%, grade F, #1,155 of 4,322 statewide, top 29%, 304 students, 47% FRL); Lyndon B Johnson Middle (math 47% / reading 52%, grade C, #356 of 1,662 statewide, top 23%, 171 students, 45% FRL); Lyndon B Johnson H S (math 64% / reading 67%, grade B, #191 of 1,632 statewide, top 12%, 247 students, 35% FRL).
- Market conditions: 229 active listings in the ZIP; 3 comparable units currently listed for rent nearby; rentals at typical pace (median 26d on market — plan ~3-4 weeks tenant-placement turnaround); 10 units permitted in Blanco County in 2024 (0 in 5+ unit buildings).
- Blanco County population projected at +14% by 2050 — modest demand growth; plan on rents tracking national, not racing it.
- 3 sale attempts since 7y ago with the ask held roughly flat each time — persistent listings suggest the price (not the market) is what's stuck; bring a comps-based counter.
- Climate carrying-cost: major wind risk, 56% chance of damaging wind over 30y; moderate wildfire risk; extreme-heat days projected 7→23/yr by 2055 (HVAC capex compounding) — expect insurance premiums to compound above CPI over the hold.
- Cap rate 8.4% vs local median 1.5% in Johnson City — top-decile yield for the area; either an underpriced asset or a hidden risk that comps aren't pricing in. Stress-test before assuming the spread holds.
Questions for listing agent
- Is there a deadline driving the sale (1031 exchange, divorce, estate, relocation)? That informs how much negotiation room exists.
- What's the average days-on-market for RENTAL listings here right now (not sales)? A rising rental-DOM trend means longer vacancies and softer asking-rent achievability than the comps imply.
- What's the recent tenant-quality profile in this submarket — average credit score on applications, eviction rate, late-payment / NSF rate, and stable-employment percentage? A property-management company in the area should have these aggregated.
- How much new for-sale + rental construction is in the pipeline within 1–3 miles? Heavy new supply typically softens prices + rents 12–24 months out; constrained supply supports both.
CashFlowRE · CFR-JA9XX9BB0KT12H
· Data 4 weeks ago
cashflowre.app · 2026-05-29