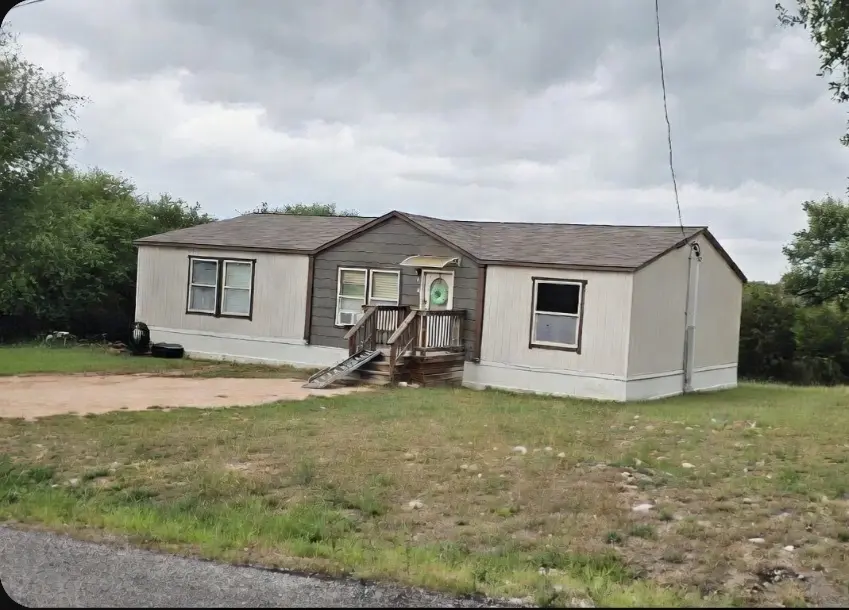
141 Brianna Cir · Johnson City, TX
Flood risk 1/10 · Minimal
- FEMA flood zone
- X
- Chance of flooding over 30 yrs
- 0.0%
- Est. flood insurance / yr
- $507 – $1,088
Fire risk 5/10 · Moderate
- Est. fire insurance / yr
- $1,222 – $2,270
Heat risk 7/10 · Major
- Hot days now (above 106°F)
- 7 days/yr
- Hot days in 30 yrs
- 23 days/yr
Wind risk 6/10 · Moderate
- Chance of severe wind over 30 yrs
- 56.0%
Air-quality risk 1/10 · Minimal
- Unhealthy air days now
- 0 days/yr
- Unhealthy air days in 30 yrs
- 0 days/yr
Risk factors via First Street. Map © Google.
Why this score? — see what drove the C grade
The composite is a weighted blend of 9 inputs, each scored 0–100. Each bar is that input's sub-score; the figure is the points it added to the 100-point composite (weight × sub-score).
- Cash flow +23.0/30.0
- ARV discount +8.8/15.0
- DSCR +7.4/10.0
- 1% rule +6.0/10.0
- Schools +4.4/10.0
- Livability +3.8/5.0
- Rent growth +2.5/5.0
- Condition / age +2.5/5.0
- Appreciation +0.0/10.0
$209,000
🖨 Deal sheet (PDF) 📄 Offer letter ✓ Due diligence
Listing remarks MLS
4 large bed, 2 bath home. 9 foot ceilings. R33 Insulation, Thermal Pane Windows, Radiant Barrier, Smart Siding, Ceiling Fans, Plank Oak Tile, Rolled Edge Counter tops, Stainless Appliances! (smooth-top range, dishwasher, side-by-side fridge, microwave) Surround Sound!, Real Wood Cabinet Doors!, Overhead Air Ducts!, Heavy Duty Fiber-Acrylic Tubs and Showers!, Upgraded trim! (baseboards, crown, casing), Accent walls, Backs to LCRA park.
Key facts
- R33 insulation
- Smart siding
- Radiant barrier
Tags
Neighborhood map
What this means for you Summary
Snapshot
- This is a 4-bed/2.0-bath manufactured listed at $209k.
Deal economics
- At list price, monthly cash flow is $370 ($4k/yr) — positive.
- The deal already cash-flows at list — no discount required.
- Meets the 1% rule at list price ($2k rent vs $209k).
- Recommended offer: $206k (1.5% below list) — sets the bar for market timing.
- Cap rate 8.4% vs local median 1.5% in Johnson City — top-decile yield for the area; either an underpriced asset or a hidden risk that comps aren't pricing in. Stress-test before assuming the spread holds.
Location & tenants
- Location reads 75/100 on livability (#131 in TX, #3,919 nationally) — a middle-class / working-renter tenant base. Strengths: crime A+, cost of living A+, housing A+; Watch: amenities F, commute F, employment D-.
- Johnson City ISD (rural): math 51% / reading 51% proficiency, ranked #141 of 826 in TX (top 17%) — acceptable for families but not a draw, mixed tenant base, ~2y average lease.
- Zoned schools: Lyndon B Johnson El (math 47% / reading 42%, grade F, #1,155 of 4,322 statewide, top 29%, 304 students, 47% FRL); Lyndon B Johnson Middle (math 47% / reading 52%, grade C, #356 of 1,662 statewide, top 23%, 171 students, 45% FRL); Lyndon B Johnson H S (math 64% / reading 67%, grade B, #191 of 1,632 statewide, top 12%, 247 students, 35% FRL).
- Market conditions: 229 active listings in the ZIP; 3 comparable units currently listed for rent nearby; rentals at typical pace (median 26d on market — plan ~3-4 weeks tenant-placement turnaround); 10 units permitted in Blanco County in 2024 (0 in 5+ unit buildings).
Forward outlook
- Local home prices are declining (-3.0%/yr); year-one equity from $1k of loan paydown is wiped out by about $6k of value loss. Plan a longer hold.
- Blanco County population projected at +14% by 2050 — modest demand growth; plan on rents tracking national, not racing it.
Negotiation context
- It's been on market 18 days — a 2% lower offer ($206k) is reasonable based on typical stale-listing flexibility.
- 3 sale attempts since 7y ago with the ask held roughly flat each time — persistent listings suggest the price (not the market) is what's stuck; bring a comps-based counter.
Risks & watch-outs
- Climate carrying-cost: major wind risk, 56% chance of damaging wind over 30y; moderate wildfire risk; extreme-heat days projected 7→23/yr by 2055 (HVAC capex compounding) — expect insurance premiums to compound above CPI over the hold.
Questions for the listing agent
- Is there a deadline driving the sale (1031 exchange, divorce, estate, relocation)? That informs how much negotiation room exists.
- What's the average days-on-market for RENTAL listings here right now (not sales)? A rising rental-DOM trend means longer vacancies and softer asking-rent achievability than the comps imply.
- What's the recent tenant-quality profile in this submarket — average credit score on applications, eviction rate, late-payment / NSF rate, and stable-employment percentage? A property-management company in the area should have these aggregated.
- How much new for-sale + rental construction is in the pipeline within 1–3 miles? Heavy new supply typically softens prices + rents 12–24 months out; constrained supply supports both.
Investment metrics
- 1% rule
- 1.10% ✓
- Cap rate
- 8.42%
- Cash-on-cash
- 7.59%
- DSCR
- 1.34
- GRM
- 7.5
CMA / ARV
- ARV (median comp)
- $215,106
- List price
- $209,000
- Delta
- -2.84%
- Verdict
- FAIR
- Comps
- 4 within 1.0 mi
Show comp detail 7 sales within ~0.75 mi
| Address | Dist | Beds/Ba | Sqft | Sold | Price | $/sf | Match |
|---|---|---|---|---|---|---|---|
| 142 Brianna Cir | 0.11mi | 4/2.0 | 1,680 (+1%) | 14mo | $230,000 | $137 | 82 |
| 130 Brianna Cir | 0.03mi | 3/2.0 (-1) | 1,568 (-6%) | 4mo | $220,000 | $140 | 81 |
| 139 Brianna Cir | 0.03mi | 3/2.0 (-1) | 1,568 (-6%) | 13mo | $230,000 | $147 | 73 |
| 107 W Dawn Dr | 0.27mi | 3/2.0 (-1) | 1,792 (+8%) | 3mo | $215,000 | $120 | 67 |
| 114 Brianna Cir | 0.07mi | 3/2.0 (-1) | 1,456 (-12%) | 10mo | $219,995 | $151 | 62 |
| 128 Brianna Cir | 0.03mi | 3/2.0 (-1) | 1,456 (-12%) | 17mo | $229,900 | $158 | 58 |
| 103 Spring View Dr | 0.29mi | 3/2.0 (-1) | 1,440 (-14%) | 2mo | $209,900 | $146 | 58 |
Match score weights: distance 35% · size 25% · config 20% · recency 20%. Top-matched comps best support the ARV.
Projected returns pro-forma
-3.0% appreciation · 3.0% rent growth · sell at horizon
- IRR
- -4.7%
- Equity multiple
- 0.82×
- Total profit
- $-10,251
- Equity at exit
- $31,163
- IRR
- 5.0%
- Equity multiple
- 1.37×
- Total profit
- $21,595
- Equity at exit
- $18,071
Cash invested: $58,520 (down + closing). Projections, not guarantees.
Landlord ↔ Tenant lean methodology
- Overall (STATE)
- 87 Strongly Landlord-Friendly
- State Texas
- 87 Strongly Landlord-Friendly · R+5
- County
- — inherits STATE
- City
- — inherits STATE
ZIP-level market 78636
- Home prices YoY
- -20.6%
- Active inventory
- 229
- Price-to-rent
- 7.5×
Monthly cashflow live
- Estimated rent
- $2,309 medium interval (Pro) →
- Mortgage (P&I)
- −$1,096
- Tax from tax record
- −$271 /mo · $3,247/yr
- Insurance
- −$87
- HOA
- −$0
- Vacancy / Maint / Mgmt
- −$485
- Net cashflow
- $370
Break-even live
Sensitivity live
| Price | -10% $488 | -5% $429 | +0% $370 | +5% $311 | +10% $252 |
|---|---|---|---|---|---|
| Rent | -10% $188 | -5% $279 | +0% $370 | +5% $461 | +10% $553 |
| Rate | -1.0pp $475 | -0.5pp $423 | base $370 | +0.5pp $316 | +1.0pp $261 |
UW: 25.0% down · 7.5% · 30yr · 1.5% tax · 5.0% vac · 8.0% maint · 8.0% mgmt
Financing live
Cash to close
- Down payment
- $52,250
- Closing costs
- $6,270
- Reserves months
- —
- Total cash needed
- —
Loan-product check · same deal, 3 products live
Conventional
25% down · 7.5% · 30yr
- Down + closing
- —
- Monthly P&I
- —
- Monthly cashflow
- —
- DSCR
- —
- Eligible?
- —
Personal DTI + credit; lowest rate.
DSCR
20% down · 8.5% · 30yr
- Down + closing
- —
- Monthly P&I
- —
- Monthly cashflow
- —
- DSCR
- —
- Eligible?
- —
No personal income docs; deal must DSCR.
Hard money
10% down · 12.0% · 12mo
- Down + closing
- —
- Monthly P&I
- —
- Monthly cashflow
- —
- DSCR
- —
- Eligible?
- —
Short-term bridge; refi at stabilization.
Rent comps 3 comps
| Address | Beds | Baths | Sqft | Rent | $/sqft | DOM | Units | Dist |
|---|---|---|---|---|---|---|---|---|
| 107 E Dawn Dr Johnson City, TX | 4.0 | 2.0 | 1596 | $2,300 | $1.44 | 19d | 1 | 0.12mi |
| 205 N Avenue J Johnson City, TX | 3.0 | 2.5 | 1959 | $2,650 | $1.35 | 45d | 1 | 1.17mi |
| 604 W Pecan Dr Johnson City, TX | 3.0 | 1.0 | 1224 | $1,950 | $1.59 | 25d | 1 | 1.47mi |
Listing history 6 events
-
2026-05-04status Pending 438-char remark
Show marketing remark (438 chars)
4 large bed, 2 bath home. 9 foot ceilings. R33 Insulation, Thermal Pane Windows, Radiant Barrier, Smart Siding, Ceiling Fans, Plank Oak Tile, Rolled Edge Counter tops, Stainless Appliances! (smooth-top range, dishwasher, side-by-side fridge, microwave) Surround Sound!, Real Wood Cabinet Doors!, Overhead Air Ducts!, Heavy Duty Fiber-Acrylic Tubs and Showers!, Upgraded trim! (baseboards, crown, casing), Accent walls, Backs to LCRA park.
-
2026-04-16$209,000 Active 438-char remark
Show marketing remark (438 chars)
4 large bed, 2 bath home. 9 foot ceilings. R33 Insulation, Thermal Pane Windows, Radiant Barrier, Smart Siding, Ceiling Fans, Plank Oak Tile, Rolled Edge Counter tops, Stainless Appliances! (smooth-top range, dishwasher, side-by-side fridge, microwave) Surround Sound!, Real Wood Cabinet Doors!, Overhead Air Ducts!, Heavy Duty Fiber-Acrylic Tubs and Showers!, Upgraded trim! (baseboards, crown, casing), Accent walls, Backs to LCRA park.
-
2019-06-30historical
-
2019-05-02$164,000
-
2019-05-01historical
-
2019-01-17$165,000
ⓘ Source: listings_history table (triggers on properties + properties_extension) + one-shot
backfill from property_details.listing_events for pre-trigger history.
Tax reassessment forecast TX · Resets to sale price
- Current annual tax
- $3,247 · $271/mo
- Projected year-2 tax
- $3,825 · $319/mo
- Expected delta
- +$578/yr (+$48/mo · 17.8%)
ⓘ Screening estimate from a state-policy table — verify with the county assessor before closing.
Climate risk First Street
- Flood 1/10 Low FEMA zone X · 0% chance over 30 yrs
- Wildfire 5/10 Major
- Heat 7/10 Severe 7 d/yr ≥106°F today · 23 d/yr by 30 yrs out
- Wind 6/10 Major 56% chance of damaging wind over 30 yrs
- Air quality 1/10 Low 0 unhealthy d/yr today · 0 by 30 yrs out
Nearby sold comps map
Loading sold comps map…
Walkable amenities ~0.75 mi
Loading nearby amenities…
Taxation est. · year 1
- Rental income
- $27,704
- − Mortgage interest
- −$11,707
- − Property taxes
- −$3,247
- − Insurance
- −$1,045
- − Repairs & maintenance
- −$2,216
- − Management
- −$2,216
- − Depreciation
- −$6,080
- Taxable income
- $1,192
- Est. tax owed @ 24.0%
- −$286
- After-tax cash flow
- $4,156/yr
For passive investors: Depreciation is non-cash, so a rental often shows a tax loss while cash-flowing — sheltering income. Rental losses are passive: they offset passive income freely, and up to $25,000/yr can offset ordinary (W-2) income if you actively participate and your MAGI is under $100k (phasing out to $0 by $150k); unused losses carry forward. On sale, claimed depreciation is recaptured at up to 25%, and gains may owe capital-gains tax (a 1031 exchange can defer both). Figures are a year-1 estimate at your 24.0% rate — not tax advice; consult a CPA.
Schools (NCES district)
- District
- Johnson City ISD
- NCES district ID
- 4824840
- Math proficiency
- 51% ▼ -10.00%
- Reading proficiency
- 51% ▬ 0.00%
- Median HH income
- $58,854
- Composite
- 44.47/100
- National rank
- #2803
- State rank
- #141 of 826 in TX
Livability — Johnson City
- Score
- 75/100
- State rank
- #131
- US rank
- #3919
Category grades
Schools grade is shown separately in the Schools card above.
Census & demographics
- Census place
- Johnson City, TX
- Population (ZIP)
- 3,842
Population outlook (Blanco County) Hauer SSP2
- Today (2025)
- 12,277 people
- By 2030
- 12,790 · +4.2%
- By 2040
- 13,520 · +10.1%
- By 2050
- 13,976 · +13.8%
- By 2075
- 15,049 · +22.6%
- By 2100
- 15,057 · +22.6%
Race, ethnicity, and origin ACS 2023
- Neighborhood character
- Predominantly White (80%)
- Race & ethnicity
- White 80% Hispanic / Latino 15% Two or more races 11% Asian 1%
- Hispanic origin (detail)
- Mexican 12%
- Common ancestry
- Slovak 5% Lithuanian 4% Serbian 2%
- Foreign-born
- 4% · Canada, Dominican Republic
- Languages at home
- 90% English-only · Spanish 7% Other Asian/Pacific 1% Other Indo-European 1%
Political lean MEDSL · Blanco
- 2024 margin
- Solid R (+52.5) · D 23.2% · R 75.7% · Other 1.1%
- 2008→2024 swing
- -13.0pp toward R · 2008: -39.5pp · 2024: -52.5pp
- All cycles
- 2024: R+52.5 2020: R+47.5 2016: R+52.4 2012: R+48.6 2008: R+39.5
Not yet ingested
- Civics
- —
Market trends
- HPI YoY
- ▼ -71.91%
- Current HPI
- 277.8899
- Rent YoY
- —
- Metro
- —
- State GDP YoY
- ▲ 3.95%
- F500 in state
- 110
Industry mix (Fortune 500 HQ in TX)
| Industry | F500 HQs | Revenue |
|---|---|---|
| Energy | 16 | $1,198B |
|
||
| Technology | 5 | $198B |
|
||
| Engineering / Construction | 4 | $72B |
|
||
| Energy Services | 3 | $60B |
|
||
| Utilities | 3 | $41B |
|
||
| Healthcare | 2 | $330B |
|
||
Price history
+26.7% since first listed6 events — show timeline
- 2026-05-04 Pending — Unlock MLS
- 2026-04-16 Listed $209,000 Unlock MLS
- 2019-06-30 Listing Removed — LERA
- 2019-05-02 Listed $164,000 LERA
- 2019-05-01 Listing Removed — LERA
- 2019-01-17 Listed $165,000 LERA
Property tax history
+28.1%/yrLatest (2025): $3,247 · -0.1% YoY. Source: county tax records.
Cash-flow waterfall
monthlySold comps — $/sqft
last 12 mo · ≤1 miLoading sold comps…