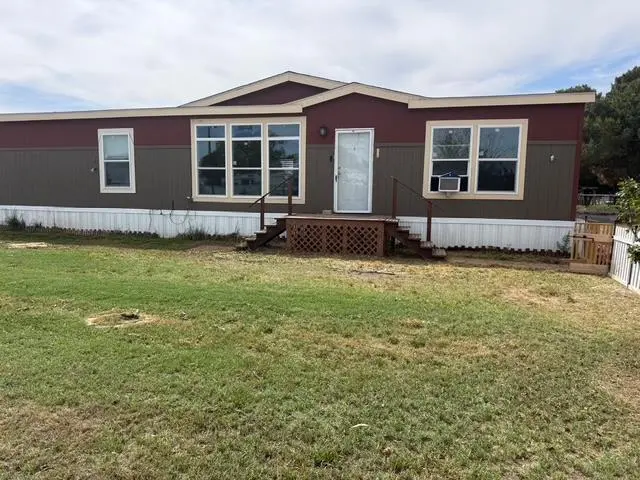
868 N Ave G
West Odessa, TX 79763
$235,000C-
4 bd · 3.0 ba ·
2,072 sqft ·
Built 2019
· Manufactured
· Active
· 54 DOM
Cashflow @ list (25.0% down · 7.5%)
Estimated rent
$2,217/mo
Mortgage (P&I)
−$1,232
Tax + insurance
−$179
HOA
−$0
Vac / Maint / Mgmt
−$466
Net cashflow
$340/mo
Annual
$4,081/yr
Cap rate
8.03%
Cash-on-cash
6.20%
DSCR
1.28
1% rule
0.94%
Cash to close
$65,800
Investor read
- This is a 4-bed/3.0-bath manufactured listed at $235k.
- At list price, monthly cash flow is $340 ($4k/yr) — positive.
- The deal already cash-flows at list — no discount required.
- To meet the 1% rule (rent ≥ 1% of price), the offer needs to be $222k (5.7% below list).
- It's been on market 54 days — a 3% lower offer ($228k) is reasonable based on typical stale-listing flexibility.
- Recommended offer: $222k (5.7% below list) — sets the bar for 1% rule.
- Local home prices are declining (-3.0%/yr); year-one equity from $2k of loan paydown is wiped out by about $7k of value loss. Plan a longer hold.
- Location reads 61/100 on livability (#1,026 in TX) — a middle-class / working-renter tenant base. Strengths: cost of living A+, housing A+; Watch: health & safety C-, crime F, amenities F.
- Ector County ISD (urban): math 22% / reading 27% proficiency, ranked #707 of 826 in TX (top 86%) — low school quality limits family demand, transient renter base, plan for 1-2y turnover.
- Zoned schools: Pease El (589 students, 79% FRL); Crockett Middle (math 21% / reading 19%, grade F, #1,428 of 1,662 statewide, top 87%, 1,036 students, 66% FRL); Odessa H S (math 18% / reading 22%, grade F, #1,397 of 1,632 statewide, top 87%, 3,874 students, 68% FRL) — zoned schools average 71% FRL vs 56% district-wide (15 pts higher); higher-poverty schools than district average — tighter screening recommended.
- Market conditions: 123 active listings in the ZIP; 1 comparable units currently listed for rent nearby; 1,004 units permitted in Ector County in 2024 (0 in 5+ unit buildings).
- Ector County population projected at +78% by 2050 — long-run rental-demand tailwind backs the buy-and-hold thesis.
- Climate carrying-cost: major wildfire risk; extreme-heat days projected 7→21/yr by 2055 (HVAC capex compounding) — expect insurance premiums to compound above CPI over the hold.
- At $2,217/mo this rent would consume 47% of the median local household income ($57k/yr) (locally 842% of renters already pay >50% of income on rent) — very limited rent-growth headroom before tenants either downsize or default.
Questions for listing agent
- It's been on market 54 days. Have you received any prior offers? Is the seller open to a 6% concession, seller financing, or rate buy-down credit?
- Is there a deadline driving the sale (1031 exchange, divorce, estate, relocation)? That informs how much negotiation room exists.
- Schools are F-rated, which usually means shorter tenancies and higher turnover. Who's the typical renter profile here, and what's been the actual vacancy rate?
- Crime grade is F in this area — have there been break-ins, vandalism, or insurance claims at this property in the last 3 years? What carrier currently insures it and at what premium?
- What's the average days-on-market for RENTAL listings here right now (not sales)? A rising rental-DOM trend means longer vacancies and softer asking-rent achievability than the comps imply.
- What's the recent tenant-quality profile in this submarket — average credit score on applications, eviction rate, late-payment / NSF rate, and stable-employment percentage? A property-management company in the area should have these aggregated.
- How much new for-sale + rental construction is in the pipeline within 1–3 miles? Heavy new supply typically softens prices + rents 12–24 months out; constrained supply supports both.
CashFlowRE · CFR-JCQH5E0S4RBR9Z
· Data 6 days ago
cashflowre.app · 2026-05-29