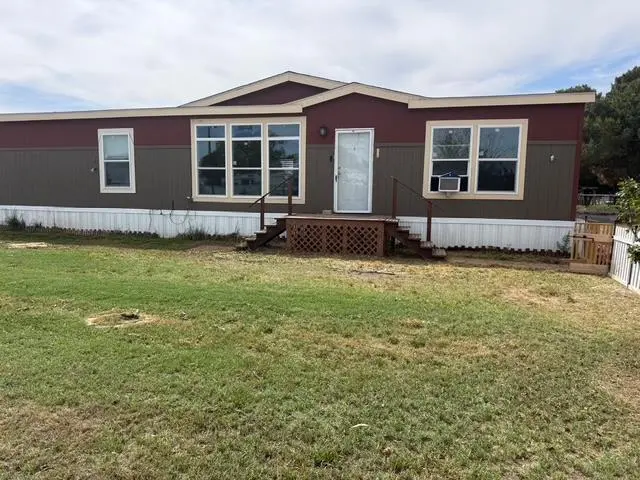
868 N Ave G · West Odessa, TX
Flood risk 1/10 · Minimal
- FEMA flood zone
- X (unshaded)
- Chance of flooding over 30 yrs
- 0.0%
- Est. flood insurance / yr
- $507 – $1,088
Fire risk 7/10 · Major
- Est. fire insurance / yr
- $1,222 – $2,270
Heat risk 6/10 · Moderate
- Hot days now (above 102°F)
- 7 days/yr
- Hot days in 30 yrs
- 21 days/yr
Wind risk 2/10 · Minimal
- Chance of severe wind over 30 yrs
- 3.0%
Air-quality risk 1/10 · Minimal
- Unhealthy air days now
- 0 days/yr
- Unhealthy air days in 30 yrs
- 0 days/yr
Risk factors via First Street. Map © Google.
Why this score? — see what drove the C- grade
The composite is a weighted blend of 9 inputs, each scored 0–100. Each bar is that input's sub-score; the figure is the points it added to the 100-point composite (weight × sub-score).
- Cash flow +21.2/30.0
- ARV discount +10.0/15.0
- DSCR +6.8/10.0
- 1% rule +4.4/10.0
- Livability +3.1/5.0
- Rent growth +2.5/5.0
- Condition / age +2.5/5.0
- Schools +2.2/10.0
- Appreciation +0.0/10.0
$235,000
🖨 Deal sheet (PDF) 📄 Offer letter ✓ Due diligence
Listing remarks
Huge Mobile home on almost 1 acre! Will be converted to real property at closing. Additional mobile home stays but is of no value. All information herein is deemed reliable but not guaranteed. Buyer to verify all Schools, Taxes and boundary lines.
Key facts
- 0.91 acre lot
- Built 2019
- Listed 53 days
Neighborhood map
What this means for you Summary
Snapshot
- This is a 4-bed/3.0-bath manufactured listed at $235k.
Deal economics
- At list price, monthly cash flow is $340 ($4k/yr) — positive.
- The deal already cash-flows at list — no discount required.
- To meet the 1% rule (rent ≥ 1% of price), the offer needs to be $222k (5.7% below list).
- Recommended offer: $222k (5.7% below list) — sets the bar for 1% rule.
Location & tenants
- Location reads 61/100 on livability (#1,026 in TX) — a middle-class / working-renter tenant base. Strengths: cost of living A+, housing A+; Watch: health & safety C-, crime F, amenities F.
- Ector County ISD (urban): math 22% / reading 27% proficiency, ranked #707 of 826 in TX (top 86%) — low school quality limits family demand, transient renter base, plan for 1-2y turnover.
- Zoned schools: Pease El (589 students, 79% FRL); Crockett Middle (math 21% / reading 19%, grade F, #1,428 of 1,662 statewide, top 87%, 1,036 students, 66% FRL); Odessa H S (math 18% / reading 22%, grade F, #1,397 of 1,632 statewide, top 87%, 3,874 students, 68% FRL) — zoned schools average 71% FRL vs 56% district-wide (15 pts higher); higher-poverty schools than district average — tighter screening recommended.
- Market conditions: 123 active listings in the ZIP; 1 comparable units currently listed for rent nearby; 1,004 units permitted in Ector County in 2024 (0 in 5+ unit buildings).
- At $2,217/mo this rent would consume 47% of the median local household income ($57k/yr) (locally 842% of renters already pay >50% of income on rent) — very limited rent-growth headroom before tenants either downsize or default.
Forward outlook
- Local home prices are declining (-3.0%/yr); year-one equity from $2k of loan paydown is wiped out by about $7k of value loss. Plan a longer hold.
- Ector County population projected at +78% by 2050 — long-run rental-demand tailwind backs the buy-and-hold thesis.
Negotiation context
- It's been on market 54 days — a 3% lower offer ($228k) is reasonable based on typical stale-listing flexibility.
Risks & watch-outs
- Climate carrying-cost: major wildfire risk; extreme-heat days projected 7→21/yr by 2055 (HVAC capex compounding) — expect insurance premiums to compound above CPI over the hold.
Questions for the listing agent
- It's been on market 54 days. Have you received any prior offers? Is the seller open to a 6% concession, seller financing, or rate buy-down credit?
- Is there a deadline driving the sale (1031 exchange, divorce, estate, relocation)? That informs how much negotiation room exists.
- Schools are F-rated, which usually means shorter tenancies and higher turnover. Who's the typical renter profile here, and what's been the actual vacancy rate?
- Crime grade is F in this area — have there been break-ins, vandalism, or insurance claims at this property in the last 3 years? What carrier currently insures it and at what premium?
- What's the average days-on-market for RENTAL listings here right now (not sales)? A rising rental-DOM trend means longer vacancies and softer asking-rent achievability than the comps imply.
- What's the recent tenant-quality profile in this submarket — average credit score on applications, eviction rate, late-payment / NSF rate, and stable-employment percentage? A property-management company in the area should have these aggregated.
- How much new for-sale + rental construction is in the pipeline within 1–3 miles? Heavy new supply typically softens prices + rents 12–24 months out; constrained supply supports both.
Investment metrics
- 1% rule
- 0.94% ✗
- Cap rate
- 8.03%
- Cash-on-cash
- 6.20%
- DSCR
- 1.28
- GRM
- 8.8
CMA / ARV
- ARV (median comp)
- $248,906
- List price
- $235,000
- Delta
- -5.59%
- Verdict
- FAIR
- Comps
- 3 within 2.0 mi
Projected returns pro-forma
-3.0% appreciation · 3.0% rent growth · sell at horizon
- IRR
- -6.8%
- Equity multiple
- 0.75×
- Total profit
- $-16,517
- Equity at exit
- $35,039
- IRR
- 2.8%
- Equity multiple
- 1.20×
- Total profit
- $13,114
- Equity at exit
- $20,319
Cash invested: $65,800 (down + closing). Projections, not guarantees.
Landlord ↔ Tenant lean methodology
- Overall (STATE)
- 87 Strongly Landlord-Friendly
- State Texas
- 87 Strongly Landlord-Friendly · R+5
- County
- — inherits STATE
- City
- — inherits STATE
ZIP-level market 79763
- Active inventory
- 123
- Price-to-rent
- 8.8×
Monthly cashflow live
- Estimated rent
- $2,217 medium interval (Pro) →
- Mortgage (P&I)
- −$1,232
- Tax from tax record
- −$81 /mo · $974/yr
- Insurance
- −$98
- HOA
- −$0
- Vacancy / Maint / Mgmt
- −$466
- Net cashflow
- $340
Break-even live
Sensitivity live
| Price | -10% $473 | -5% $407 | +0% $340 | +5% $274 | +10% $207 |
|---|---|---|---|---|---|
| Rent | -10% $165 | -5% $253 | +0% $340 | +5% $428 | +10% $515 |
| Rate | -1.0pp $458 | -0.5pp $400 | base $340 | +0.5pp $279 | +1.0pp $217 |
UW: 25.0% down · 7.5% · 30yr · 1.5% tax · 5.0% vac · 8.0% maint · 8.0% mgmt
Financing live
Cash to close
- Down payment
- $58,750
- Closing costs
- $7,050
- Reserves months
- —
- Total cash needed
- —
Loan-product check · same deal, 3 products live
Conventional
25% down · 7.5% · 30yr
- Down + closing
- —
- Monthly P&I
- —
- Monthly cashflow
- —
- DSCR
- —
- Eligible?
- —
Personal DTI + credit; lowest rate.
DSCR
20% down · 8.5% · 30yr
- Down + closing
- —
- Monthly P&I
- —
- Monthly cashflow
- —
- DSCR
- —
- Eligible?
- —
No personal income docs; deal must DSCR.
Hard money
10% down · 12.0% · 12mo
- Down + closing
- —
- Monthly P&I
- —
- Monthly cashflow
- —
- DSCR
- —
- Eligible?
- —
Short-term bridge; refi at stabilization.
Rent comps 1 comps
| Address | Beds | Baths | Sqft | Rent | $/sqft | DOM | Units | Dist |
|---|---|---|---|---|---|---|---|---|
| 537 Avenue B Unit B Odessa, TX | 4.0 | 2.0 | 1918 | $2,300 | $1.20 | 45d | 1 | 0.48mi |
Listing history 9 events
-
2026-06-16days on market $235,000 Active 54 DOM
-
2026-06-15days on market $235,000 Active 53 DOM
-
2026-06-14days on market $235,000 Active 51 DOM
-
2026-06-13days on market $235,000 Active 50 DOM
-
2026-06-03days on market $235,000 Active 44 DOM
-
2026-06-01days on market $235,000 Active 43 DOM
-
2026-05-31days on market $235,000 Active 42 DOM
-
2026-05-30days on market $235,000 Active 41 DOM
-
2026-04-20$235,000 Active 247-char remark
ⓘ Source: listings_history table (triggers on properties + properties_extension) + one-shot
backfill from property_details.listing_events for pre-trigger history.
Tax reassessment forecast TX · Resets to sale price
- Current annual tax
- $974 · $81/mo
- Projected year-2 tax
- $4,300 · $358/mo
- Expected delta
- +$3,326/yr (+$277/mo · 341.5%)
ⓘ Screening estimate from a state-policy table — verify with the county assessor before closing.
Climate risk First Street
- Flood 1/10 Low FEMA zone X (unshaded) · 0% chance over 30 yrs
- Wildfire 7/10 Severe
- Heat 6/10 Major 7 d/yr ≥102°F today · 21 d/yr by 30 yrs out
- Wind 2/10 Low 3% chance of damaging wind over 30 yrs
- Air quality 1/10 Low 0 unhealthy d/yr today · 0 by 30 yrs out
Nearby sold comps map
Loading sold comps map…
Walkable amenities ~0.75 mi
Loading nearby amenities…
Taxation est. · year 1
- Rental income
- $26,606
- − Mortgage interest
- −$13,164
- − Property taxes
- −$974
- − Insurance
- −$1,175
- − Repairs & maintenance
- −$2,128
- − Management
- −$2,128
- − Depreciation
- −$6,836
- Taxable income
- $200
- Est. tax owed @ 24.0%
- −$48
- After-tax cash flow
- $4,033/yr
For passive investors: Depreciation is non-cash, so a rental often shows a tax loss while cash-flowing — sheltering income. Rental losses are passive: they offset passive income freely, and up to $25,000/yr can offset ordinary (W-2) income if you actively participate and your MAGI is under $100k (phasing out to $0 by $150k); unused losses carry forward. On sale, claimed depreciation is recaptured at up to 25%, and gains may owe capital-gains tax (a 1031 exchange can defer both). Figures are a year-1 estimate at your 24.0% rate — not tax advice; consult a CPA.
Schools (NCES district)
- District
- Ector County ISD
- NCES district ID
- 4818000
- Math proficiency
- 22% ▼ -9.00%
- Reading proficiency
- 27% ▼ -4.00%
- Median HH income
- $52,740
- Composite
- 21.89/100
- National rank
- #8233
- State rank
- #707 of 826 in TX
Livability — West Odessa
- Score
- 61/100
- State rank
- #1026
- US rank
- #18223
Category grades
Schools grade is shown separately in the Schools card above.
Census & demographics
- Census place
- West Odessa, TX
- County
- Ector County · 131,169 people
- City population
- 61,683
- Metro
- Odessa, TX
- Population (ZIP)
- 35,174
- Household income
- $56,877
- Rent vs Own
- Severe rent burden
- 842.0
Population outlook (Ector County) Hauer SSP2
- Today (2025)
- 212,765 people
- By 2030
- 241,962 · +13.7%
- By 2040
- 306,582 · +44.1%
- By 2050
- 379,755 · +78.5%
- By 2075
- 568,991 · +167.4%
- By 2100
- 709,829 · +233.6%
Race, ethnicity, and origin ACS 2023
- Neighborhood character
- Predominantly Hispanic (76%)
- Race & ethnicity
- Hispanic / Latino 76% Two or more races 24% White 19% Black 2%
- Hispanic origin (detail)
- Mexican 72%
- Common ancestry
- Lithuanian 1% Slovak 1%
- Foreign-born
- 22% · Canada
- Languages at home
- 39% English-only · Spanish 60%
Political lean MEDSL · Ector
- 2024 margin
- Solid R (+52.9) · D 23.2% · R 76.1%
- 2008→2024 swing
- -4.9pp toward R · 2008: -48.0pp · 2024: -52.9pp
- All cycles
- 2024: R+52.9 2020: R+47.8 2016: R+40.6 2012: R+48.9 2008: R+48.0
Not yet ingested
- Civics
- —
Market trends
- HPI YoY
- ▼ -213.81%
- Current HPI
- 254.9773
- Rent YoY
- —
- Metro
- Odessa, TX
- State GDP YoY
- ▲ 3.95%
- F500 in state
- 110
Industry mix (Fortune 500 HQ in TX)
| Industry | F500 HQs | Revenue |
|---|---|---|
| Energy | 16 | $1,198B |
|
||
| Technology | 5 | $198B |
|
||
| Engineering / Construction | 4 | $72B |
|
||
| Energy Services | 3 | $60B |
|
||
| Utilities | 3 | $41B |
|
||
| Healthcare | 2 | $330B |
|
||
Property tax history
+7.3%/yrLatest (2025): $974 · +1855.4% YoY. Source: county tax records.
Cash-flow waterfall
monthlySold comps — $/sqft
last 12 mo · ≤1 miLoading sold comps…