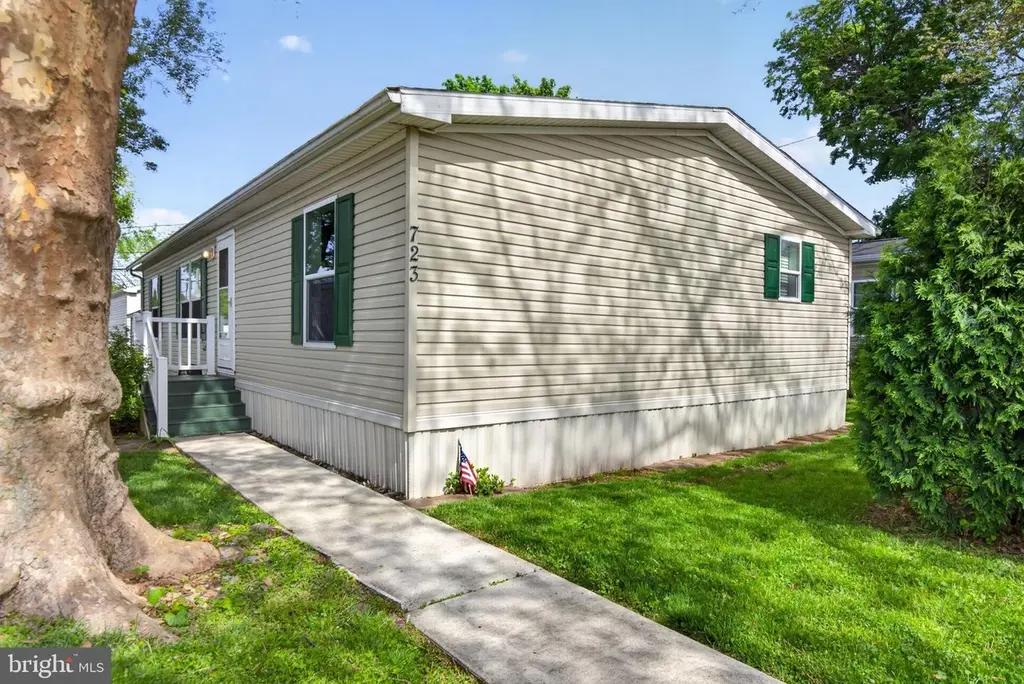
723 Sherry Ln
Lancaster, PA 17601
$132,500B+
3 bd · 2.0 ba ·
1,344 sqft ·
Built 2011
· Manufactured
· Pending
· 52 DOM
Cashflow @ list (25.0% down · 7.5%)
Estimated rent
$2,091/mo
Mortgage (P&I)
−$695
Tax + insurance
−$149
HOA
−$0
Vac / Maint / Mgmt
−$439
Net cashflow
$808/mo
Annual
$9,697/yr
Cap rate
13.61%
Cash-on-cash
26.14%
DSCR
2.16
1% rule
1.58%
Cash to close
$37,100
Investor read
- This is a 3-bed/2.0-bath manufactured listed at $132k.
- At list price, monthly cash flow is $808 ($10k/yr) — positive.
- The deal already cash-flows at list — no discount required.
- Meets the 1% rule at list price ($2k rent vs $132k).
- It's been on market 52 days — a 3% lower offer ($129k) is reasonable based on typical stale-listing flexibility.
- Recommended offer: $129k (3.0% below list) — sets the bar for market timing.
- Local home prices are declining (-3.0%/yr); year-one equity from $916 of loan paydown is wiped out by about $4k of value loss. Plan a longer hold.
- Location reads 85/100 on livability (#71 in PA, #498 nationally) — a professional / high-income tenant draw. Strengths: amenities A+, commute A+, cost of living A+; Watch: crime C-, employment C-.
- Conestoga Valley SD (suburban): math 43% / reading 59% proficiency, ranked #156 of 539 in PA (top 29%) — acceptable for families but not a draw, mixed tenant base, ~2y average lease.
- Zoned schools: Fritz El Sch (math 30% / reading 57%, grade F, #866 of 1,518 statewide, top 57%, 534 students, 57% FRL); Gerald G Huesken Ms (math 35% / reading 55%, grade D, #187 of 512 statewide, top 38%, 965 students, 50% FRL); Conestoga Valley Shs (math 75% / reading 24%, grade D+, #135 of 437 statewide, top 31%, 1,282 students, 41% FRL) — zoned schools average 49% FRL vs 27% district-wide (22 pts higher); higher-poverty schools than district average — tighter screening recommended.
- Market conditions: Rents rising (+4.0%/yr); 327 active listings in the ZIP; 4 comparable units currently listed for rent nearby; rentals lingering (median 46d on market — plan ~5-8 weeks vacancy on turnover, expect pricing pressure); 75% of comp listings sitting > 30 days — soft ceiling on asking rent; solid renter incomes; 1,093 units permitted in Lancaster County in 2024 (201 in 5+ unit buildings).
- Lancaster County population projected at +5% by 2050 — modest demand growth; plan on rents tracking national, not racing it.
- 2 sale attempts with the ask held roughly flat each time — persistent listings suggest the price (not the market) is what's stuck; bring a comps-based counter.
- At projected returns (-3.0% appreciation + 4.0% rent growth), your $37k cash investment doubles in ~5 years — after that, you're playing with house money.
- Cap rate 13.6% vs local median 4.3% in Lancaster — top-decile yield for the area; either an underpriced asset or a hidden risk that comps aren't pricing in. Stress-test before assuming the spread holds.
Questions for listing agent
- It's been on market 52 days. Have you received any prior offers? Is the seller open to a 3% concession, seller financing, or rate buy-down credit?
- Is there a deadline driving the sale (1031 exchange, divorce, estate, relocation)? That informs how much negotiation room exists.
- What's the average days-on-market for RENTAL listings here right now (not sales)? A rising rental-DOM trend means longer vacancies and softer asking-rent achievability than the comps imply.
- What's the recent tenant-quality profile in this submarket — average credit score on applications, eviction rate, late-payment / NSF rate, and stable-employment percentage? A property-management company in the area should have these aggregated.
- How much new for-sale + rental construction is in the pipeline within 1–3 miles? Heavy new supply typically softens prices + rents 12–24 months out; constrained supply supports both.
CashFlowRE · CFR-JD0JSB59KK669Y
· Data 1 week ago
cashflowre.app · 2026-05-29