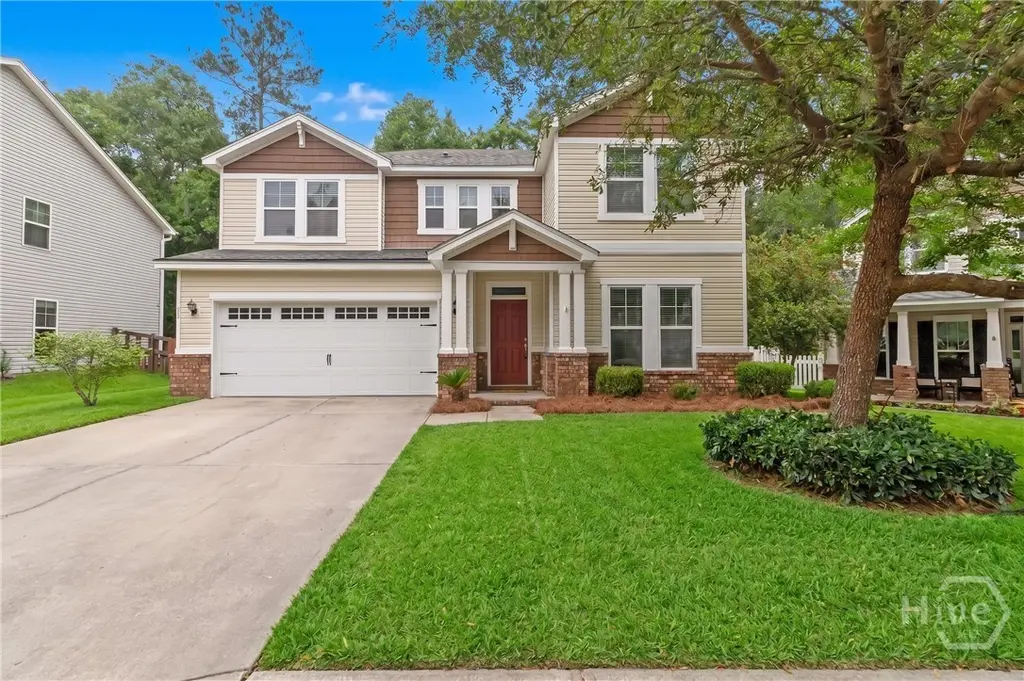
97 Salt Grass Cir
Richmond Hill, GA 31324
$394,000D-
5 bd · 3.0 ba ·
2,351 sqft ·
Built 2012
· SingleFamily
· Active
· 92 DOM
Cashflow @ list (25.0% down · 7.5%)
Estimated rent
$2,957/mo
Mortgage (P&I)
−$2,066
Tax + insurance
−$483
HOA
−$100
Vac / Maint / Mgmt
−$621
Net cashflow
$-313/mo
Annual
$-3,759/yr
Cap rate
5.34%
Cash-on-cash
-3.41%
DSCR
0.85
1% rule
0.75%
Cash to close
$110,320
Investor read
- This is a 5-bed/3.0-bath single-family listed at $394k.
- At list price, monthly cash flow is $-313 ($-4k/yr) — negative.
- To cash-flow at today's rent, offer at most $339k (14.0% below list).
- To meet the 1% rule (rent ≥ 1% of price), the offer needs to be $296k (24.9% below list).
- It's been on market 92 days — a 9% lower offer ($359k) is reasonable based on typical stale-listing flexibility.
- Recommended offer: $296k (24.9% below list) — sets the bar for 1% rule.
- Local home prices are declining (-3.0%/yr); year-one equity from $3k of loan paydown is wiped out by about $12k of value loss. Plan a longer hold.
- Location reads 69/100 on livability (#122 in GA) — a middle-class / working-renter tenant base. Strengths: housing A+, crime A, schools B+; Watch: amenities F, commute F, health & safety F.
- Bryan County (rural): math 49% / reading 53% proficiency, ranked #14 of 174 in GA (top 8%) — acceptable for families but not a draw, mixed tenant base, ~2y average lease.
- Market conditions: Rents rising (+2.2%/yr); 482 active listings in the ZIP; 3 comparable units currently listed for rent nearby; rentals at typical pace (median 21d on market — plan ~3-4 weeks tenant-placement turnaround); high-income renter base; 510 units permitted in Bryan County in 2024 (68 in 5+ unit buildings).
- Bryan County population projected at +64% by 2050 — long-run rental-demand tailwind backs the buy-and-hold thesis.
- 10 sale attempts since 15y ago with the ask held roughly flat each time — persistent listings suggest the price (not the market) is what's stuck; bring a comps-based counter.
- Current owner paid $253k; list at $394k implies a 56% gain — meaningful room to come down on a strong offer.
- Climate carrying-cost: severe wind risk, 99% chance of damaging wind over 30y; major wildfire risk; extreme-heat days projected 7→19/yr by 2055 (HVAC capex compounding) — expect insurance premiums to compound above CPI over the hold.
- Cap rate 5.3% vs local median 4.1% in Richmond Hill — top-decile yield for the area; either an underpriced asset or a hidden risk that comps aren't pricing in. Stress-test before assuming the spread holds.
Questions for listing agent
- What do current leases actually rent for vs. the listed asking? Can we see a recent rent roll and the last 12 months of T-12 income?
- It's been on market 92 days. Have you received any prior offers? Is the seller open to a 25% concession, seller financing, or rate buy-down credit?
- What does the HOA fee cover, when was the last increase, and are there any pending special assessments or reserve-fund shortfalls?
- Why hasn't it sold? Are there any deal-killer items the seller is aware of (foundation, flood, title, zoning, code violations)?
- Is there a deadline driving the sale (1031 exchange, divorce, estate, relocation)? That informs how much negotiation room exists.
- Schools are B-rated — typically a magnet for longer-tenancy family renters. What's the average tenant stay here, and is there a school-zone premium baked into asking?
- The area grade is low — what's the realistic commute time and amenity access for the typical tenant pool here? Any planned neighborhood developments (good or bad) we should know about?
- What's the average days-on-market for RENTAL listings here right now (not sales)? A rising rental-DOM trend means longer vacancies and softer asking-rent achievability than the comps imply.
CashFlowRE · CFR-JDH9F2AYH8MA7M
· Data 2 days ago
cashflowre.app · 2026-05-29