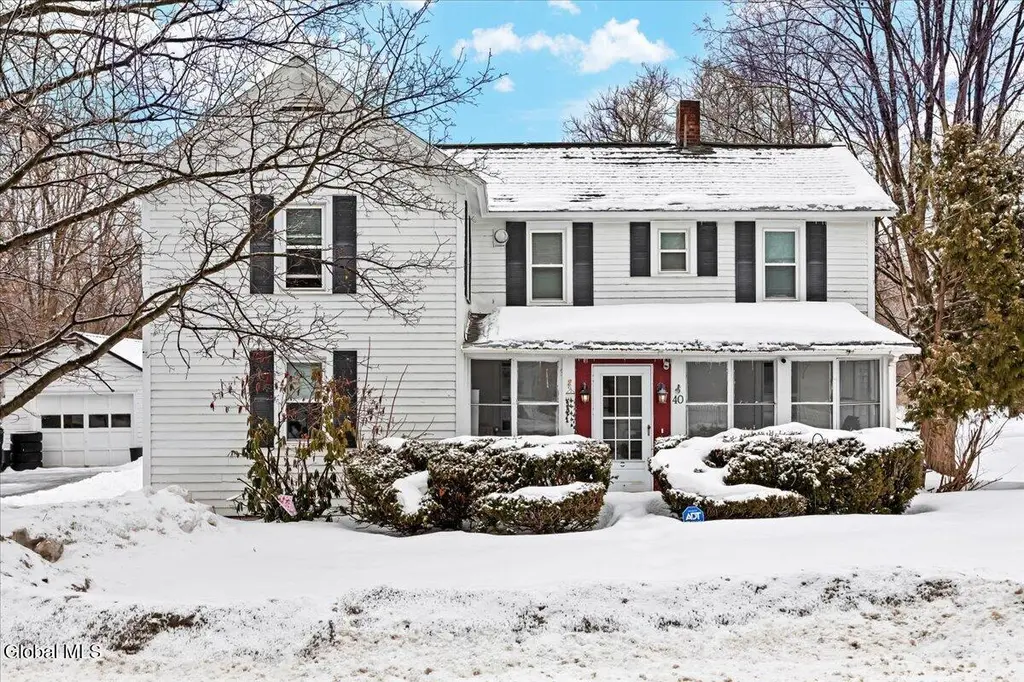
40 Leonard St
Fort Edward, NY 12831
$269,900C-
3 bd · 1.0 ba ·
2,636 sqft ·
Built 1901
· SingleFamily
· Pending
· 5 DOM
Cashflow @ list (25.0% down · 7.5%)
Estimated rent
$2,873/mo
Mortgage (P&I)
−$1,415
Tax + insurance
−$553
HOA
−$0
Vac / Maint / Mgmt
−$603
Net cashflow
$302/mo
Annual
$3,619/yr
Cap rate
7.63%
Cash-on-cash
4.79%
DSCR
1.21
1% rule
1.06%
Cash to close
$75,572
Investor read
- This is a 3-bed/1.0-bath single-family listed at $270k.
- At list price, monthly cash flow is $302 ($4k/yr) — positive.
- The deal already cash-flows at list — no discount required.
- Meets the 1% rule at list price ($3k rent vs $270k).
- Only 5 days on market — expect competitive offers; lowballing is unlikely to land.
- Local home prices are declining (-3.0%/yr); year-one equity from $2k of loan paydown is wiped out by about $8k of value loss. Plan a longer hold.
- Location reads 73/100 on livability (#334 in NY) — a middle-class / working-renter tenant base. Strengths: housing A+, health & safety A+, cost of living A; Watch: commute D+, employment D, amenities F.
- South Glens Falls Central School District (suburban): math 49% / reading 59% proficiency, ranked #307 of 590 in NY (top 52%) — acceptable for families but not a draw, mixed tenant base, ~2y average lease.
- Zoned schools: Ballard Elementary School (math 52% / reading 52%, grade C-, #988 of 2,108 statewide, top 49%, 309 students, 32% FRL); South Glens Falls Senior High School (math 92% / reading 91%, grade A+, #197 of 1,100 statewide, top 18%, 908 students, 36% FRL).
- Zoned-school proficiency averages 72% at this address vs 54% district-wide (+18 pts) — the actual schools serving this property are materially stronger than the South Glens Falls Central School District average implies; a family-tenant draw the district grade alone would hide.
- Watch-outs: built in 1901 — expect roof / HVAC / electrical / plumbing capex.
- Market conditions: 113 active listings in the ZIP; solid renter incomes; 1,132 units permitted in Saratoga County in 2024 (378 in 5+ unit buildings).
- Saratoga County population projected at +4% by 2050 — modest demand growth; plan on rents tracking national, not racing it.
- 5 sale attempts since 29y ago with the ask held roughly flat each time — persistent listings suggest the price (not the market) is what's stuck; bring a comps-based counter.
- Current owner paid $186k; 45% above their basis — modest negotiation headroom, anchor on the comps not their cost.
- Cap rate 7.6% vs local median 4.0% in Fort Edward — top-decile yield for the area; either an underpriced asset or a hidden risk that comps aren't pricing in. Stress-test before assuming the spread holds.
- This rent runs 34% of the median local income ($100k/yr) — at the standard rent-burdened threshold; future hikes will face affordability resistance.
Questions for listing agent
- Built in 1901 — when were the roof, HVAC, electrical panel, plumbing, and water heater last replaced?
- Is there a deadline driving the sale (1031 exchange, divorce, estate, relocation)? That informs how much negotiation room exists.
- Schools are D-rated, which usually means shorter tenancies and higher turnover. Who's the typical renter profile here, and what's been the actual vacancy rate?
- What's the average days-on-market for RENTAL listings here right now (not sales)? A rising rental-DOM trend means longer vacancies and softer asking-rent achievability than the comps imply.
- What's the recent tenant-quality profile in this submarket — average credit score on applications, eviction rate, late-payment / NSF rate, and stable-employment percentage? A property-management company in the area should have these aggregated.
- How much new for-sale + rental construction is in the pipeline within 1–3 miles? Heavy new supply typically softens prices + rents 12–24 months out; constrained supply supports both.
CashFlowRE · CFR-JF7T1C6DGENB47
· Data 3 weeks ago
cashflowre.app · 2026-05-29