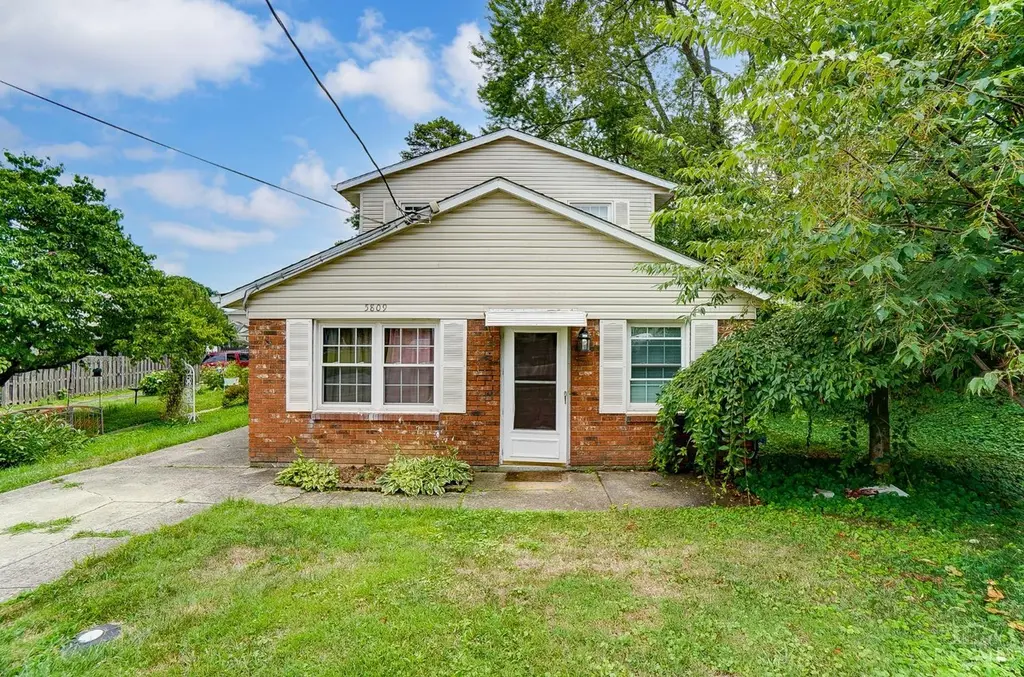
5809 Elder St
Fairfax, OH 45227
$325,000D+
5 bd · 2.0 ba ·
2,141 sqft ·
Built 1966
· SingleFamily
· Active
· 13 DOM
Cashflow @ list (25.0% down · 7.5%)
Estimated rent
$2,877/mo
Mortgage (P&I)
−$1,704
Tax + insurance
−$791
HOA
−$0
Vac / Maint / Mgmt
−$604
Net cashflow
$-222/mo
Annual
$-2,666/yr
Cap rate
5.47%
Cash-on-cash
-2.93%
DSCR
0.87
1% rule
0.89%
Cash to close
$91,000
Investor read
- This is a 5-bed/2.0-bath single-family listed at $325k.
- At list price, monthly cash flow is $-222 ($-3k/yr) — negative.
- To cash-flow at today's rent, offer at most $286k (12.1% below list).
- To meet the 1% rule (rent ≥ 1% of price), the offer needs to be $288k (11.5% below list).
- Only 13 days on market — expect competitive offers; lowballing is unlikely to land.
- Recommended offer: $286k (12.1% below list) — sets the bar for cash-flow.
- Local home prices are declining (-3.0%/yr); year-one equity from $2k of loan paydown is wiped out by about $10k of value loss. Plan a longer hold.
- Location reads 81/100 on livability (#91 in OH, #1,359 nationally) — a professional / high-income tenant draw. Strengths: commute A+, cost of living A+, housing A+; Watch: crime C-, amenities D.
- Mariemont City (suburban): math 89% / reading 92% proficiency, ranked #2 of 656 in OH (top 0%) — strong family-tenant draw, lease renewals of 3-5y typical; only 8% free/reduced lunch — higher-income household profile.
- Zoned schools: Mariemont Elementary School (math 88% / reading 88%, grade A+, #34 of 1,584 statewide, top 2%, 505 students, 8% FRL); Mariemont Junior High School (math 90% / reading 94%, grade A+, #2 of 654 statewide, top 0%, 267 students, 10% FRL); Mariemont High School (math 82% / reading 98%, grade A+, #2 of 781 statewide, top 0%, 448 students, 0% FRL) — zoned schools at 6% FRL track the district average.
- Market conditions: Rents rising fast (+5.9%/yr); 69 active listings in the ZIP; 3 comparable units currently listed for rent nearby; rentals leasing fast (median 10d on market — plan ~1-2 weeks tenant-placement turnaround); 801 units permitted in Hamilton County in 2024 (190 in 5+ unit buildings).
- 6 sale attempts since 7y ago with the ask held roughly flat each time — persistent listings suggest the price (not the market) is what's stuck; bring a comps-based counter.
- Climate carrying-cost: extreme-heat days projected 7→19/yr by 2055 (HVAC capex compounding) — expect insurance premiums to compound above CPI over the hold.
- At $2,877/mo this rent would consume 48% of the median local household income ($72k/yr) (locally 1046% of renters already pay >50% of income on rent) — very limited rent-growth headroom before tenants either downsize or default.
Questions for listing agent
- What do current leases actually rent for vs. the listed asking? Can we see a recent rent roll and the last 12 months of T-12 income?
- Built in 1966 — when were the roof, HVAC, electrical panel, plumbing, and water heater last replaced?
- Is there a deadline driving the sale (1031 exchange, divorce, estate, relocation)? That informs how much negotiation room exists.
- The area grade is low — what's the realistic commute time and amenity access for the typical tenant pool here? Any planned neighborhood developments (good or bad) we should know about?
- What's the average days-on-market for RENTAL listings here right now (not sales)? A rising rental-DOM trend means longer vacancies and softer asking-rent achievability than the comps imply.
- What's the recent tenant-quality profile in this submarket — average credit score on applications, eviction rate, late-payment / NSF rate, and stable-employment percentage? A property-management company in the area should have these aggregated.
- How much new for-sale + rental construction is in the pipeline within 1–3 miles? Heavy new supply typically softens prices + rents 12–24 months out; constrained supply supports both.
CashFlowRE · CFR-JFE2SD7JRAK8YR
· Data 1 day ago
cashflowre.app · 2026-05-29