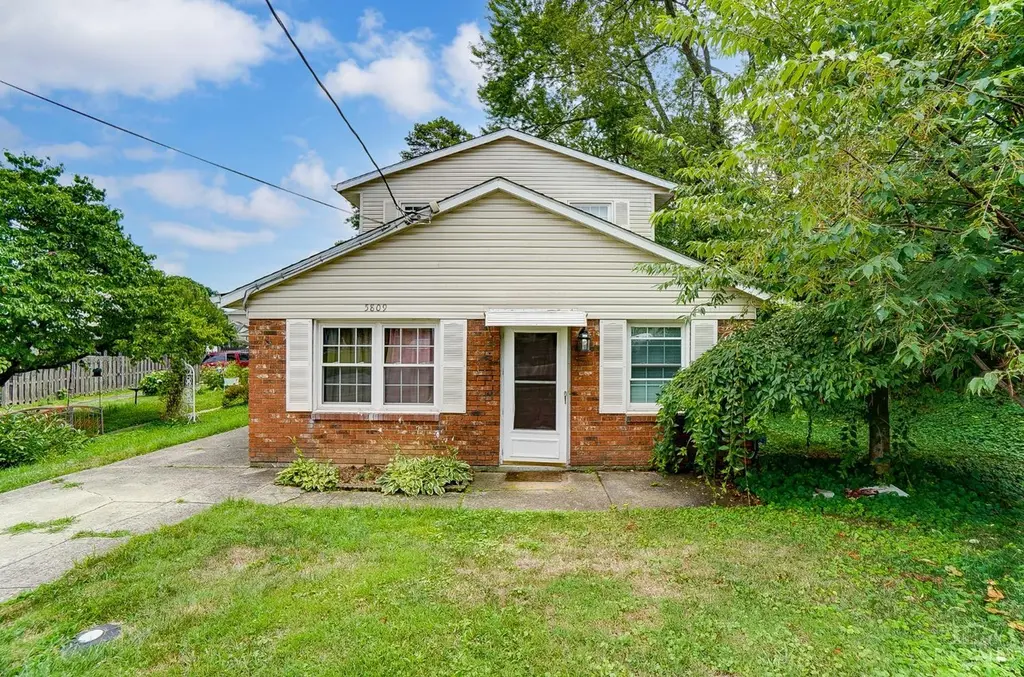
5809 Elder St · Fairfax, OH
Flood risk 1/10 · Minimal
- FEMA flood zone
- X (unshaded)
- Chance of flooding over 30 yrs
- 0.0%
- Est. flood insurance / yr
- $473 – $860
Fire risk 1/10 · Minimal
- Est. fire insurance / yr
- $713 – $1,323
Heat risk 5/10 · Moderate
- Hot days now (above 103°F)
- 7 days/yr
- Hot days in 30 yrs
- 19 days/yr
Wind risk 2/10 · Minimal
- Chance of severe wind over 30 yrs
- 1.0%
Air-quality risk 3/10 · Minor
- Unhealthy air days now
- 2 days/yr
- Unhealthy air days in 30 yrs
- 4 days/yr
Risk factors via First Street. Map © Google.
Why this score? — see what drove the D+ grade
The composite is a weighted blend of 9 inputs, each scored 0–100. Each bar is that input's sub-score; the figure is the points it added to the 100-point composite (weight × sub-score).
- ARV discount +15.0/15.0
- Cash flow +9.6/30.0
- Schools +7.9/10.0
- Rent growth +4.0/5.0
- Livability +4.0/5.0
- 1% rule +3.9/10.0
- DSCR +2.7/10.0
- Condition / age +2.5/5.0
- Appreciation +0.0/10.0
$325,000
🖨 Deal sheet (PDF) 📄 Offer letter ✓ Due diligence
Listing remarks
Welcome home to this beautifully maintained property, offering comfort, flexibility, and exceptional updates throughout. The spacious second-floor in-law suite features its own private entrance, separate furnace, and laundry area, providing endless possibilities. Use it as a private living space, convert it into a luxurious primary suite with an additional bedroom, nursery, or home office, or generate additional income as a rental opportunity. Recent improvements include a modernized kitchen, updated bathroom, elegant granite countertops, a new roof and gutters installed in 2019, and updated mechanicals. With two furnaces and laundry facilities on both levels, this home is designed for conv
Key facts
- Modernized kitchen
- Laundry area
- Private entrance
Tags
Property features AI
Finance
- Other: Zoned residential; Lot approximately 0.117 acres; Basement area: finished space present (approx. 692)
- HOA & community: No HOA
Exterior
- Parking: Off-street parking
- Utilities: Public water; Public sewer; Natural gas; Electric water heater
- Home design: Single family home; Two levels; Architectural style: Other; Entry level: 1
- Construction: Brick and vinyl siding exterior; Shingle roof; Slab foundation; 220 volt service
- Exterior features: Double-hung vinyl windows; Busline nearby
Interior
- Kitchen: Counter bar; Kitchen island; Marble/Granite/Slate countertops
- Bedrooms: 3 bedrooms total; Primary bedroom 16 x 11 (level 1); Bedroom 2 10 x 8 (level 1); Bedroom 3 10 x 8 (level 1)
- Flooring: Wood floor; Laminate floor
- Bathrooms: 2 full bathrooms; Full bath on level 1; Full bath on level 2
- Heating & cooling: Electric forced-air heating; Central air conditioning
- Interior features: Fireplace; Ceiling fan; Cable available; Total of 7 rooms
- Laundry & utility: Washer and dryer included
Neighborhood map
What this means for you Summary
Snapshot
- This is a 5-bed/2.0-bath single-family listed at $325k.
Deal economics
- At list price, monthly cash flow is $-222 ($-3k/yr) — negative.
- To cash-flow at today's rent, offer at most $286k (12.1% below list).
- To meet the 1% rule (rent ≥ 1% of price), the offer needs to be $288k (11.5% below list).
- Recommended offer: $286k (12.1% below list) — sets the bar for cash-flow.
Location & tenants
- Location reads 81/100 on livability (#91 in OH, #1,359 nationally) — a professional / high-income tenant draw. Strengths: commute A+, cost of living A+, housing A+; Watch: crime C-, amenities D.
- Mariemont City (suburban): math 89% / reading 92% proficiency, ranked #2 of 656 in OH (top 0%) — strong family-tenant draw, lease renewals of 3-5y typical; only 8% free/reduced lunch — higher-income household profile.
- Zoned schools: Mariemont Elementary School (math 88% / reading 88%, grade A+, #34 of 1,584 statewide, top 2%, 505 students, 8% FRL); Mariemont Junior High School (math 90% / reading 94%, grade A+, #2 of 654 statewide, top 0%, 267 students, 10% FRL); Mariemont High School (math 82% / reading 98%, grade A+, #2 of 781 statewide, top 0%, 448 students, 0% FRL) — zoned schools at 6% FRL track the district average.
- Market conditions: Rents rising fast (+5.9%/yr); 69 active listings in the ZIP; 3 comparable units currently listed for rent nearby; rentals leasing fast (median 10d on market — plan ~1-2 weeks tenant-placement turnaround); 801 units permitted in Hamilton County in 2024 (190 in 5+ unit buildings).
- At $2,877/mo this rent would consume 48% of the median local household income ($72k/yr) (locally 1046% of renters already pay >50% of income on rent) — very limited rent-growth headroom before tenants either downsize or default.
Forward outlook
- Local home prices are declining (-3.0%/yr); year-one equity from $2k of loan paydown is wiped out by about $10k of value loss. Plan a longer hold.
Negotiation context
- Only 13 days on market — expect competitive offers; lowballing is unlikely to land.
- 6 sale attempts since 7y ago with the ask held roughly flat each time — persistent listings suggest the price (not the market) is what's stuck; bring a comps-based counter.
Risks & watch-outs
- Climate carrying-cost: extreme-heat days projected 7→19/yr by 2055 (HVAC capex compounding) — expect insurance premiums to compound above CPI over the hold.
Questions for the listing agent
- What do current leases actually rent for vs. the listed asking? Can we see a recent rent roll and the last 12 months of T-12 income?
- Built in 1966 — when were the roof, HVAC, electrical panel, plumbing, and water heater last replaced?
- Is there a deadline driving the sale (1031 exchange, divorce, estate, relocation)? That informs how much negotiation room exists.
- The area grade is low — what's the realistic commute time and amenity access for the typical tenant pool here? Any planned neighborhood developments (good or bad) we should know about?
- What's the average days-on-market for RENTAL listings here right now (not sales)? A rising rental-DOM trend means longer vacancies and softer asking-rent achievability than the comps imply.
- What's the recent tenant-quality profile in this submarket — average credit score on applications, eviction rate, late-payment / NSF rate, and stable-employment percentage? A property-management company in the area should have these aggregated.
- How much new for-sale + rental construction is in the pipeline within 1–3 miles? Heavy new supply typically softens prices + rents 12–24 months out; constrained supply supports both.
Investment metrics
- 1% rule
- 0.89% ✗
- Cap rate
- 5.47%
- Cash-on-cash
- -2.93%
- DSCR
- 0.87
- GRM
- 9.4
CMA / ARV
- ARV (on-the-fly)
- $554,519
- Comps found
- 12
Show comp detail 12 sales within ~0.75 mi
| Address | Dist | Beds/Ba | Sqft | Sold | Price | $/sf | Match |
|---|---|---|---|---|---|---|---|
| 3933 Germania Ave | 0.13mi | 4/2.5 (-1) | 2,102 (-2%) | 11mo | $801,568 | $381 | 74 |
| 3714 Lonsdale St | 0.22mi | 4/2.0 (-1) | 2,144 (+0%) | 21mo | $345,000 | $161 | 67 |
| 5719 Arnsby Pl | 0.44mi | 4/2.5 (-1) | 2,117 (-1%) | 10mo | $637,500 | $301 | 62 |
| 6602 Miami Bluff Dr | 0.67mi | 4/2.0 (-1) | 2,125 (-1%) | 4mo | $950,000 | $447 | 60 |
| 6640 Elm St | 0.61mi | 4/3.0 (-1) | 2,080 (-3%) | 1mo | $735,000 | $353 | 57 |
| 4403 Simpson Ave | 0.60mi | 4/2.0 (-1) | 2,088 (-2%) | 13mo | $225,000 | $108 | 52 |
| 6121 Roe St | 0.74mi | 4/2.5 (-1) | 2,063 (-4%) | 3mo | $495,000 | $240 | 50 |
| 4133 La Crosse Ave | 0.60mi | 4/1.5 (-1) | 2,232 (+4%) | 10mo | $426,000 | $191 | 49 |
| 4101 Watterson St | 0.35mi | 4/2.5 (-1) | 1,926 (-10%) | 21mo | $435,000 | $226 | 42 |
| 5737 Whitney Ave | 0.65mi | 4/2.5 (-1) | 1,967 (-8%) | 14mo | $510,000 | $259 | 38 |
| 4426 Whetsel Ave | 0.62mi | 4/2.5 (-1) | 1,931 (-10%) | 15mo | $475,000 | $246 | 35 |
| 3773 Harvard Acres | 0.47mi | 4/3.0 (-1) | 1,844 (-14%) | 15mo | $495,000 | $268 | 33 |
Match score weights: distance 35% · size 25% · config 20% · recency 20%. Top-matched comps best support the ARV.
Projected returns pro-forma
-3.0% appreciation · 5.86% rent growth · sell at horizon
- IRR
- -17.6%
- Equity multiple
- 0.36×
- Total profit
- $-58,103
- Equity at exit
- $48,459
- IRR
- -4.5%
- Equity multiple
- 0.66×
- Total profit
- $-30,962
- Equity at exit
- $28,100
Cash invested: $91,000 (down + closing). Projections, not guarantees.
Landlord ↔ Tenant lean methodology
- Overall (STATE)
- 73 Landlord-Friendly
- State Ohio
- 73 Landlord-Friendly · R+6
- County
- — inherits STATE
- City
- — inherits STATE
ZIP-level market 45227
- Rents YoY
- 5.9%
- Active inventory
- 69
- Price-to-rent
- 9.4×
Monthly cashflow live
- Estimated rent
- $2,877 medium interval (Pro) →
- Mortgage (P&I)
- −$1,704
- Tax from tax record
- −$655 /mo · $7,862/yr
- Insurance
- −$135
- HOA
- −$0
- Vacancy / Maint / Mgmt
- −$604
- Net cashflow
- $-222
Break-even live
Sensitivity live
| Price | -10% $-38 | -5% $-130 | +0% $-222 | +5% $-314 | +10% $-406 |
|---|---|---|---|---|---|
| Rent | -10% $-449 | -5% $-336 | +0% $-222 | +5% $-109 | +10% $5 |
| Rate | -1.0pp $-59 | -0.5pp $-140 | base $-222 | +0.5pp $-306 | +1.0pp $-392 |
UW: 25.0% down · 7.5% · 30yr · 1.5% tax · 5.0% vac · 8.0% maint · 8.0% mgmt
Financing live
Cash to close
- Down payment
- $81,250
- Closing costs
- $9,750
- Reserves months
- —
- Total cash needed
- —
Loan-product check · same deal, 3 products live
Conventional
25% down · 7.5% · 30yr
- Down + closing
- —
- Monthly P&I
- —
- Monthly cashflow
- —
- DSCR
- —
- Eligible?
- —
Personal DTI + credit; lowest rate.
DSCR
20% down · 8.5% · 30yr
- Down + closing
- —
- Monthly P&I
- —
- Monthly cashflow
- —
- DSCR
- —
- Eligible?
- —
No personal income docs; deal must DSCR.
Hard money
10% down · 12.0% · 12mo
- Down + closing
- —
- Monthly P&I
- —
- Monthly cashflow
- —
- DSCR
- —
- Eligible?
- —
Short-term bridge; refi at stabilization.
Rent comps 3 comps
| Address | Beds | Baths | Sqft | Rent | $/sqft | DOM | Units | Dist |
|---|---|---|---|---|---|---|---|---|
| 3805 Meadowlark Ln Cincinnati, OH | 4.0 | 2.0 | 1665 | $2,900 | $1.74 | 3d | 1 | 0.21mi |
| 6304 Desmond St Cincinnati, OH | 4.0 | 1.5 | 1900 | $2,750 | $1.45 | 9d | 1 | 1.25mi |
| 6303 Chandler St Cincinnati, OH | 4.0 | 2.5 | 1732 | $3,300 | $1.91 | 13d | 1 | 1.30mi |
Listing history 8 events
-
2026-06-21days on market $325,000 Active 13 DOM
-
2026-06-18days on market $325,000 Active 10 DOM
-
2026-06-17days on market $325,000 Active 9 DOM
-
2026-06-16days on market $325,000 Active 8 DOM
-
2026-06-15days on market $325,000 Active 7 DOM
-
2026-06-13days on market $325,000 Active 5 DOM
-
2026-06-08remarks 699-char remark
-
2026-06-08$325,000 Active 1 DOM
ⓘ Source: listings_history table (triggers on properties + properties_extension) + one-shot
backfill from property_details.listing_events for pre-trigger history.
Tax reassessment forecast OH · Partial reset (capped growth)
- Current annual tax
- $7,862 · $655/mo
- Projected year-2 tax
- $7,862 · $655/mo
- Expected delta
- $0/yr ($0/mo · 0.0%)
ⓘ Screening estimate from a state-policy table — verify with the county assessor before closing.
Climate risk First Street
- Flood 1/10 Low FEMA zone X (unshaded) · 0% chance over 30 yrs
- Wildfire 1/10 Low
- Heat 5/10 Major 7 d/yr ≥103°F today · 19 d/yr by 30 yrs out
- Wind 2/10 Low 100% chance of damaging wind over 30 yrs
- Air quality 3/10 Moderate 2 unhealthy d/yr today · 4 by 30 yrs out
Nearby sold comps map
Loading sold comps map…
Walkable amenities ~0.75 mi
Loading nearby amenities…
Taxation est. · year 1
- Rental income
- $34,523
- − Mortgage interest
- −$18,205
- − Property taxes
- −$7,862
- − Insurance
- −$1,625
- − Repairs & maintenance
- −$2,762
- − Management
- −$2,762
- − Depreciation
- −$9,455
- Taxable loss
- −$8,148
- Est. tax savings @ 24.0%
- +$1,955
- After-tax cash flow
- $-711/yr
For passive investors: Depreciation is non-cash, so a rental often shows a tax loss while cash-flowing — sheltering income. Rental losses are passive: they offset passive income freely, and up to $25,000/yr can offset ordinary (W-2) income if you actively participate and your MAGI is under $100k (phasing out to $0 by $150k); unused losses carry forward. On sale, claimed depreciation is recaptured at up to 25%, and gains may owe capital-gains tax (a 1031 exchange can defer both). Figures are a year-1 estimate at your 24.0% rate — not tax advice; consult a CPA.
Schools (NCES district)
- District
- Mariemont City
- NCES district ID
- 3904431
- Math proficiency
- 89% ▼ -2.00%
- Reading proficiency
- 92% ▬ 0.00%
- Median HH income
- $82,717
- Composite
- 79.49/100
- National rank
- #61
- State rank
- #2 of 656 in OH
Livability — Fairfax
- Score
- 81/100
- State rank
- #91
- US rank
- #1359
Category grades
Schools grade is shown separately in the Schools card above.
Census & demographics
- Census place
- Fairfax, OH
- County
- Hamilton County · 701,295 people
- Metro
- Cincinnati, OH-KY-IN
- Population (ZIP)
- 18,893
- Household income
- $71,646
- Rent vs Own
- Severe rent burden
- 1046.0
Population outlook (Hamilton County) Hauer SSP2
- Today (2025)
- 826,054 people
- By 2030
- 830,947 · +0.6%
- By 2040
- 832,319 · +0.8%
- By 2050
- 822,428 · -0.4%
- By 2075
- 788,688 · -4.5%
- By 2100
- 710,674 · -14.0%
Race, ethnicity, and origin ACS 2023
- Neighborhood character
- Predominantly White (72%)
- Race & ethnicity
- White 72% Black 21% Two or more races 5% Hispanic / Latino 2% Asian 1%
- Common ancestry
- Slovak 2% Romanian 2% Lithuanian 1%
- Foreign-born
- 2% · Canada
- Languages at home
- 97% English-only · Spanish 2%
Political lean MEDSL · Hamilton
- 2024 margin
- D (+14.9) · D 57.0% · R 42.1%
- 2008→2024 swing
- +7.9pp toward D · 2008: 7.0pp · 2024: 14.9pp
- All cycles
- 2024: D+14.9 2020: D+15.9 2016: D+9.5 2012: D+4.9 2008: D+7.0
Not yet ingested
- Civics
- —
Market trends
- HPI YoY
- ▼ -256.16%
- Current HPI
- 240.4507
- Rent YoY
- ▲ 5.86%
- Metro
- Cincinnati, OH-KY-IN
- State GDP YoY
- ▲ 1.98%
- F500 in state
- 48
Industry mix (Fortune 500 HQ in OH)
| Industry | F500 HQs | Revenue |
|---|---|---|
| Insurance | 3 | $145B |
|
||
| Industrial Machinery | 3 | $49B |
|
||
| Financial Services | 3 | $24B |
|
||
| Consumer Goods | 2 | $93B |
|
||
| Aerospace / Defense | 2 | $47B |
|
||
| Utilities | 2 | $33B |
|
||
Price history
+228.9% since first listed18 events — show timeline
- 2026-06-05 Listed $325,000 Cincy MLS
- 2026-01-01 Listing Removed — CBRMLS
- 2025-08-22 Listed $339,000 CBRMLS
- 2024-12-12 Listing Removed — CBRMLS
- 2024-11-18 Price Changed $350,000 CBRMLS
- 2024-10-14 Listed $367,900 CBRMLS
- 2024-08-14 Listing Removed — CBRMLS
- 2024-07-30 Price Changed $374,900 CBRMLS
- 2024-07-15 Listed $379,900 CBRMLS
- 2022-08-24 Sold (Public Records) $300,000 Public Records
- 2022-08-12 Sold (MLS) $300,000 Cincy MLS
- 2022-06-28 Contingent — Cincy MLS
- 2022-06-20 Listed $299,900 Cincy MLS
- 2019-07-30 Sold (Public Records) $240,000 Public Records
- 2019-07-26 Sold (MLS) $240,000 Cincy MLS
- 2019-06-10 Contingent — Cincy MLS
- 2019-05-25 Listed $245,000 Cincy MLS
- 2003-06-23 Sold (Public Records) $98,800 Public Records
Property tax history
+7.3%/yrLatest (2025): $7,862 · +2.2% YoY. Source: county tax records.
Cash-flow waterfall
monthlySold comps — $/sqft
last 12 mo · ≤1 miLoading sold comps…