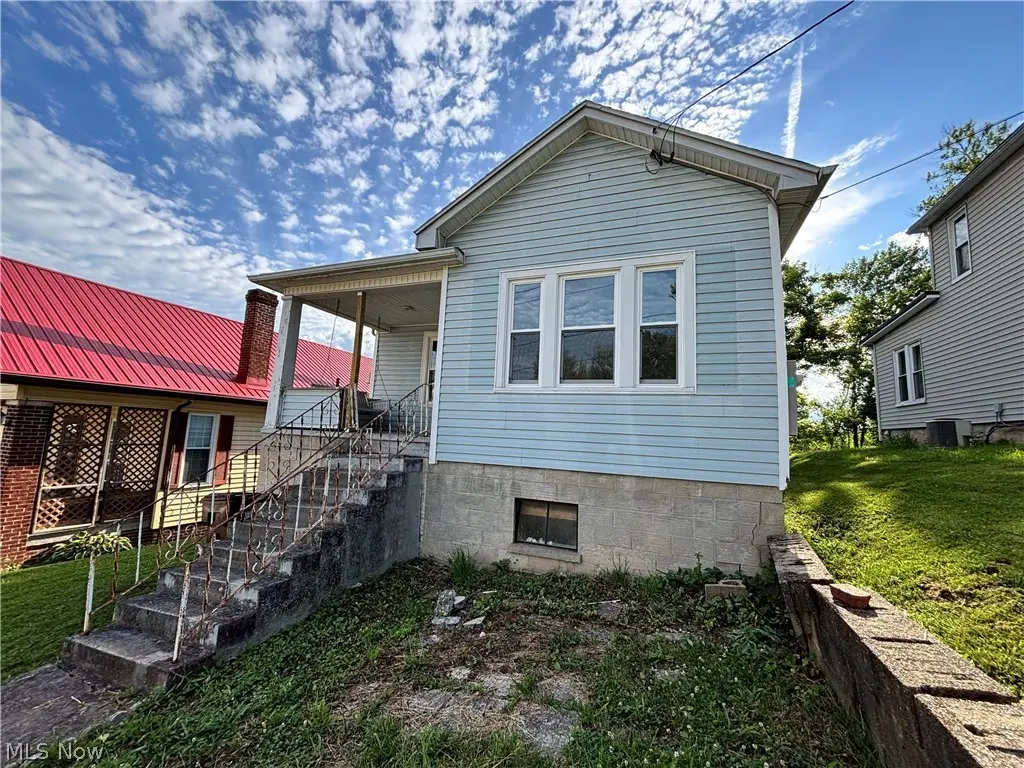
809 Garfield Ave
Marietta, OH 45750
$52,500B
2 bd · 1.0 ba ·
1,326 sqft ·
Built 1950
· SingleFamily
· Active
· 1 DOM
Cashflow @ list (25.0% down · 7.5%)
Estimated rent
$1,670/mo
Mortgage (P&I)
−$275
Tax + insurance
−$103
HOA
−$0
Vac / Maint / Mgmt
−$351
Net cashflow
$941/mo
Annual
$11,294/yr
Cap rate
27.80%
Cash-on-cash
76.83%
DSCR
4.42
1% rule
3.18%
Cash to close
$14,700
Investor read
- This is a 2-bed/1.0-bath single-family listed at $52k.
- At list price, monthly cash flow is $941 ($11k/yr) — positive.
- The deal already cash-flows at list — no discount required.
- Meets the 1% rule at list price ($2k rent vs $52k).
- Only 1 days on market — expect competitive offers; lowballing is unlikely to land.
- Local home prices are declining (-3.0%/yr); year-one equity from $363 of loan paydown is wiped out by about $2k of value loss. Plan a longer hold.
- Location reads 80/100 on livability (#127 in OH, #1,845 nationally) — a professional / high-income tenant draw. Strengths: cost of living A+, housing A+, health & safety A+; Watch: commute F, employment D-.
- Marietta City (town): math 35% / reading 49% proficiency, ranked #534 of 656 in OH (top 81%) — families likely to look elsewhere, expect single-tenant / working-renter base with shorter leases.
- Watch-outs: built in 1950 — expect roof / HVAC / electrical / plumbing capex.
- Market conditions: 118 active listings in the ZIP; 3 comparable units currently listed for rent nearby; rentals lingering (median 45d on market — plan ~5-8 weeks vacancy on turnover, expect pricing pressure); 100% of comp listings sitting > 30 days — soft ceiling on asking rent; 3 units permitted in Washington County in 2024 (0 in 5+ unit buildings).
- Washington County population projected at -12% by 2050 — secular population decline; favor cash flow + early exit over multi-decade hold.
- Current owner paid $32k; list at $52k implies a 64% gain — meaningful room to come down on a strong offer.
- At projected returns (-3.0% appreciation + 3.0% rent growth), your $15k cash investment doubles in ~2 years — after that, you're playing with house money.
- Cap rate 27.8% vs local median 6.3% in Marietta — top-decile yield for the area; either an underpriced asset or a hidden risk that comps aren't pricing in. Stress-test before assuming the spread holds.
- This rent runs 33% of the median local income ($60k/yr) — at the standard rent-burdened threshold; future hikes will face affordability resistance.
Questions for listing agent
- Built in 1950 — when were the roof, HVAC, electrical panel, plumbing, and water heater last replaced?
- Is there a deadline driving the sale (1031 exchange, divorce, estate, relocation)? That informs how much negotiation room exists.
- Schools are B-rated — typically a magnet for longer-tenancy family renters. What's the average tenant stay here, and is there a school-zone premium baked into asking?
- What's the average days-on-market for RENTAL listings here right now (not sales)? A rising rental-DOM trend means longer vacancies and softer asking-rent achievability than the comps imply.
- What's the recent tenant-quality profile in this submarket — average credit score on applications, eviction rate, late-payment / NSF rate, and stable-employment percentage? A property-management company in the area should have these aggregated.
- How much new for-sale + rental construction is in the pipeline within 1–3 miles? Heavy new supply typically softens prices + rents 12–24 months out; constrained supply supports both.
CashFlowRE · CFR-JG6ERP79MCFWG8
· Data 2 days ago
cashflowre.app · 2026-05-29