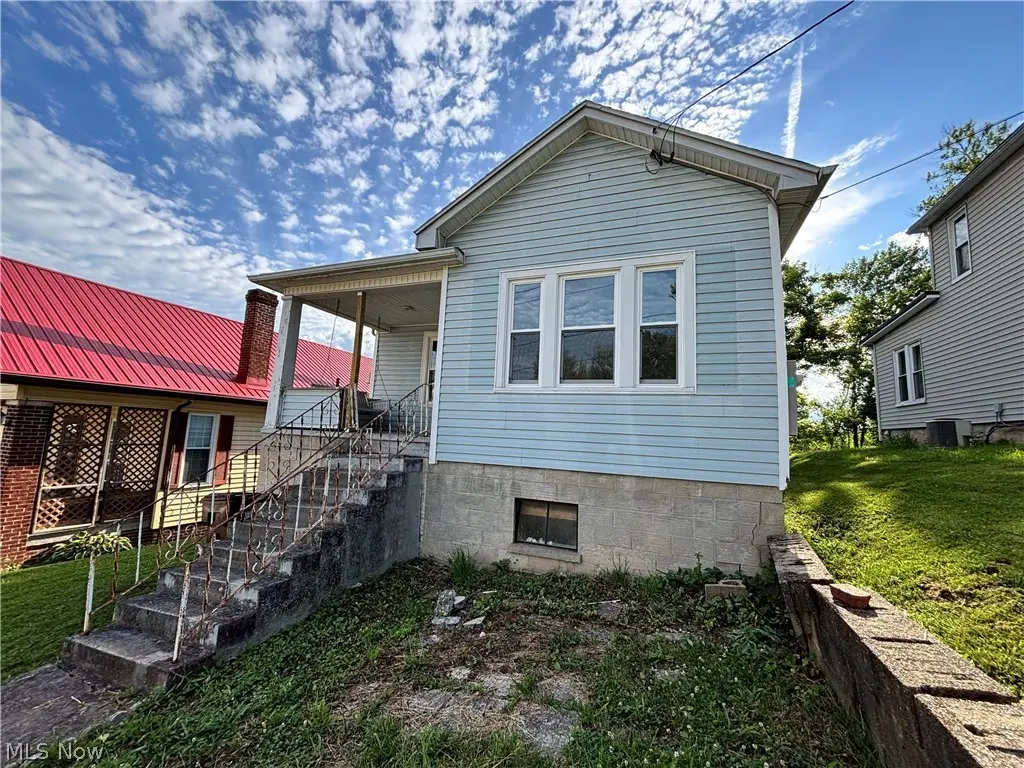
809 Garfield Ave · Marietta, OH
Flood risk 1/10 · Minimal
- FEMA flood zone
- X (unshaded)
- Chance of flooding over 30 yrs
- 0.0%
- Est. flood insurance / yr
- $473 – $860
Fire risk 3/10 · Minor
- Est. fire insurance / yr
- $713 – $1,323
Heat risk 4/10 · Minor
- Hot days now (above 101°F)
- 7 days/yr
- Hot days in 30 yrs
- 18 days/yr
Wind risk 1/10 · Minimal
- Chance of severe wind over 30 yrs
- 1.0%
Air-quality risk 2/10 · Minimal
- Unhealthy air days now
- 0 days/yr
- Unhealthy air days in 30 yrs
- 1 days/yr
Risk factors via First Street. Map © Google.
Why this score? — see what drove the B grade
The composite is a weighted blend of 9 inputs, each scored 0–100. Each bar is that input's sub-score; the figure is the points it added to the 100-point composite (weight × sub-score).
- Cash flow +30.0/30.0
- 1% rule +10.0/10.0
- DSCR +10.0/10.0
- ARV discount +7.5/15.0
- Livability +4.0/5.0
- Schools +3.5/10.0
- Rent growth +2.5/5.0
- Condition / age +2.5/5.0
- Appreciation +0.0/10.0
$52,500
🖨 Deal sheet (PDF) 📄 Offer letter ✓ Due diligence
Listing remarks
Investor Special- Endless Possibilities. Looking for your next flip, rental, or renovation project? This property is packed with potential and ready for your vision. Potential for 4 bedrooms, 1-bathroom, spacious layout with room to reconfigure and maximize value. New windows, exterior doors, plumbing, and electrical. It's a blank canvas ready for additional updates & customization. Conveniently located near the hospital, shopping, restaurants, and other local amenities. Owner is OLREA.
Key facts
- New plumbing
- New exterior doors
- New electrical
Tags
Property features AI
Exterior
- Parking: Off-street parking
- Utilities: Public water; Public sewer; Gas for heating
- Home design: Single-story home; 1,126 above-grade finished area
- Construction: Vinyl siding; Block foundation; Shingle roof; Built (year source: public records)
- Exterior features: Lot recorded by assessor
Interior
- Kitchen: Range
- Bedrooms: Two main-level bedrooms
- Bathrooms: One full bathroom (main level)
- Heating & cooling: Forced-air heating (gas)
- Interior features: Double-pane windows; Has basement; Property listed as fixer condition
- Laundry & utility: Laundry in basement
Neighborhood map
What this means for you Summary
Snapshot
- This is a 2-bed/1.0-bath single-family listed at $52k.
Deal economics
- At list price, monthly cash flow is $941 ($11k/yr) — positive.
- The deal already cash-flows at list — no discount required.
- Meets the 1% rule at list price ($2k rent vs $52k).
- Cap rate 27.8% vs local median 6.3% in Marietta — top-decile yield for the area; either an underpriced asset or a hidden risk that comps aren't pricing in. Stress-test before assuming the spread holds.
Location & tenants
- Location reads 80/100 on livability (#127 in OH, #1,845 nationally) — a professional / high-income tenant draw. Strengths: cost of living A+, housing A+, health & safety A+; Watch: commute F, employment D-.
- Marietta City (town): math 35% / reading 49% proficiency, ranked #534 of 656 in OH (top 81%) — families likely to look elsewhere, expect single-tenant / working-renter base with shorter leases.
- Market conditions: 118 active listings in the ZIP; 3 comparable units currently listed for rent nearby; rentals lingering (median 45d on market — plan ~5-8 weeks vacancy on turnover, expect pricing pressure); 100% of comp listings sitting > 30 days — soft ceiling on asking rent; 3 units permitted in Washington County in 2024 (0 in 5+ unit buildings).
- This rent runs 33% of the median local income ($60k/yr) — at the standard rent-burdened threshold; future hikes will face affordability resistance.
Forward outlook
- Local home prices are declining (-3.0%/yr); year-one equity from $363 of loan paydown is wiped out by about $2k of value loss. Plan a longer hold.
- Washington County population projected at -12% by 2050 — secular population decline; favor cash flow + early exit over multi-decade hold.
- At projected returns (-3.0% appreciation + 3.0% rent growth), your $15k cash investment doubles in ~2 years — after that, you're playing with house money.
Negotiation context
- Only 1 days on market — expect competitive offers; lowballing is unlikely to land.
- Current owner paid $32k; list at $52k implies a 64% gain — meaningful room to come down on a strong offer.
Risks & watch-outs
- Watch-outs: built in 1950 — expect roof / HVAC / electrical / plumbing capex.
Questions for the listing agent
- Built in 1950 — when were the roof, HVAC, electrical panel, plumbing, and water heater last replaced?
- Is there a deadline driving the sale (1031 exchange, divorce, estate, relocation)? That informs how much negotiation room exists.
- Schools are B-rated — typically a magnet for longer-tenancy family renters. What's the average tenant stay here, and is there a school-zone premium baked into asking?
- What's the average days-on-market for RENTAL listings here right now (not sales)? A rising rental-DOM trend means longer vacancies and softer asking-rent achievability than the comps imply.
- What's the recent tenant-quality profile in this submarket — average credit score on applications, eviction rate, late-payment / NSF rate, and stable-employment percentage? A property-management company in the area should have these aggregated.
- How much new for-sale + rental construction is in the pipeline within 1–3 miles? Heavy new supply typically softens prices + rents 12–24 months out; constrained supply supports both.
Investment metrics
- 1% rule
- 3.18% ✓
- Cap rate
- 27.80%
- Cash-on-cash
- 76.83%
- DSCR
- 4.42
- GRM
- 2.6
CMA / ARV
- ARV (on-the-fly)
- $151,164
- Comps found
- 12
Show comp detail 12 sales within ~0.75 mi
| Address | Dist | Beds/Ba | Sqft | Sold | Price | $/sf | Match |
|---|---|---|---|---|---|---|---|
| 828 Fifth St | 0.05mi | 3/1.0 (+1) | 1,352 (+2%) | 4mo | $135,000 | $100 | 86 |
| 708 N 7th St | 0.33mi | 3/1.5 (+1) | 1,296 (-2%) | 1mo | $169,000 | $130 | 73 |
| 723 N 7th St | 0.27mi | 3/1.0 (+1) | 1,264 (-5%) | 4mo | $160,000 | $127 | 72 |
| 813 3rd St | 0.24mi | 2/1.0 | 1,407 (+6%) | 10mo | $200,000 | $142 | 70 |
| 624 9th St | 0.52mi | 3/1.0 (+1) | 1,296 (-2%) | 1mo | $164,000 | $127 | 66 |
| 203 Marion St | 0.27mi | 2/1.5 | 1,223 (-8%) | 8mo | $140,000 | $114 | 66 |
| 903 Warren St | 0.45mi | 3/1.0 (+1) | 1,324 (-0%) | 13mo | $110,000 | $83 | 63 |
| 617 8th St | 0.48mi | 3/2.0 (+1) | 1,368 (+3%) | 13mo | $151,750 | $111 | 53 |
| 101 Gibbons Pl | 0.67mi | 3/2.0 (+1) | 1,288 (-3%) | 6mo | $40,000 | $31 | 50 |
| 710 8th St | 0.37mi | 3/1.0 (+1) | 1,456 (+10%) | 14mo | $154,500 | $106 | 50 |
| 118 Rathbone Rd | 0.54mi | 3/1.5 (+1) | 1,464 (+10%) | 4mo | $215,000 | $147 | 46 |
| 131 Cullen Rd | 0.44mi | 2/2.0 | 1,511 (+14%) | 12mo | $85,000 | $56 | 42 |
Match score weights: distance 35% · size 25% · config 20% · recency 20%. Top-matched comps best support the ARV.
Projected returns pro-forma
-3.0% appreciation · 3.0% rent growth · sell at horizon
- IRR
- 76.8%
- Equity multiple
- 4.50×
- Total profit
- $51,470
- Equity at exit
- $7,828
- IRR
- 80.4%
- Equity multiple
- 9.31×
- Total profit
- $122,145
- Equity at exit
- $4,539
Cash invested: $14,700 (down + closing). Projections, not guarantees.
Landlord ↔ Tenant lean methodology
- Overall (STATE)
- 73 Landlord-Friendly
- State Ohio
- 73 Landlord-Friendly · R+6
- County
- — inherits STATE
- City
- — inherits STATE
ZIP-level market 45750
- Home prices YoY
- -32.4%
- Active inventory
- 118
- Price-to-rent
- 2.6×
Monthly cashflow live
- Estimated rent
- $1,670 medium interval (Pro) →
- Mortgage (P&I)
- −$275
- Tax from tax record
- −$81 /mo · $972/yr
- Insurance
- −$22
- HOA
- −$0
- Vacancy / Maint / Mgmt
- −$351
- Net cashflow
- $941
Break-even live
Sensitivity live
| Price | -10% $971 | -5% $956 | +0% $941 | +5% $926 | +10% $911 |
|---|---|---|---|---|---|
| Rent | -10% $809 | -5% $875 | +0% $941 | +5% $1,007 | +10% $1,073 |
| Rate | -1.0pp $968 | -0.5pp $955 | base $941 | +0.5pp $928 | +1.0pp $914 |
UW: 25.0% down · 7.5% · 30yr · 1.5% tax · 5.0% vac · 8.0% maint · 8.0% mgmt
Financing live
Cash to close
- Down payment
- $13,125
- Closing costs
- $1,575
- Reserves months
- —
- Total cash needed
- —
Loan-product check · same deal, 3 products live
Conventional
25% down · 7.5% · 30yr
- Down + closing
- —
- Monthly P&I
- —
- Monthly cashflow
- —
- DSCR
- —
- Eligible?
- —
Personal DTI + credit; lowest rate.
DSCR
20% down · 8.5% · 30yr
- Down + closing
- —
- Monthly P&I
- —
- Monthly cashflow
- —
- DSCR
- —
- Eligible?
- —
No personal income docs; deal must DSCR.
Hard money
10% down · 12.0% · 12mo
- Down + closing
- —
- Monthly P&I
- —
- Monthly cashflow
- —
- DSCR
- —
- Eligible?
- —
Short-term bridge; refi at stabilization.
Rent comps 3 comps
| Address | Beds | Baths | Sqft | Rent | $/sqft | DOM | Units | Dist |
|---|---|---|---|---|---|---|---|---|
| 803 3rd St Marietta, OH | 3.0 | 2.0 | 1659 | $2,000 | $1.21 | 44d | 1 | 0.28mi |
| 628 2nd St Unit Downstairs Marietta, OH | 1.0 | 1.0 | 1024 | $1,600 | $1.56 | 44d | 1 | 0.48mi |
| 108 Putnam St Unit A Marietta, OH | 1.0 | 1.0 | 1100 | $1,499 | $1.36 | 44d | 1 | 1.11mi |
Listing history 2 events
-
2026-06-19remarks 493-char remark
-
2026-06-19$52,500 Active 1 DOM
ⓘ Source: listings_history table (triggers on properties + properties_extension) + one-shot
backfill from property_details.listing_events for pre-trigger history.
Tax reassessment forecast OH · Partial reset (capped growth)
- Current annual tax
- $972 · $81/mo
- Projected year-2 tax
- $972 · $81/mo
- Expected delta
- $0/yr ($0/mo · -0.0%)
ⓘ Screening estimate from a state-policy table — verify with the county assessor before closing.
Climate risk First Street
- Flood 1/10 Low FEMA zone X (unshaded) · 0% chance over 30 yrs
- Wildfire 3/10 Moderate
- Heat 4/10 Moderate 7 d/yr ≥101°F today · 18 d/yr by 30 yrs out
- Wind 1/10 Low 100% chance of damaging wind over 30 yrs
- Air quality 2/10 Low 0 unhealthy d/yr today · 1 by 30 yrs out
Nearby sold comps map
Loading sold comps map…
Walkable amenities ~0.75 mi
Loading nearby amenities…
Taxation est. · year 1
- Rental income
- $20,040
- − Mortgage interest
- −$2,941
- − Property taxes
- −$972
- − Insurance
- −$262
- − Repairs & maintenance
- −$1,603
- − Management
- −$1,603
- − Depreciation
- −$1,527
- Taxable income
- $11,131
- Est. tax owed @ 24.0%
- −$2,672
- After-tax cash flow
- $8,622/yr
For passive investors: Depreciation is non-cash, so a rental often shows a tax loss while cash-flowing — sheltering income. Rental losses are passive: they offset passive income freely, and up to $25,000/yr can offset ordinary (W-2) income if you actively participate and your MAGI is under $100k (phasing out to $0 by $150k); unused losses carry forward. On sale, claimed depreciation is recaptured at up to 25%, and gains may owe capital-gains tax (a 1031 exchange can defer both). Figures are a year-1 estimate at your 24.0% rate — not tax advice; consult a CPA.
Schools (NCES district)
- District
- Marietta City
- NCES district ID
- 3910019
- Math proficiency
- 35% ▼ -20.00%
- Reading proficiency
- 49% ▼ -12.00%
- Median HH income
- $39,366
- Composite
- 35.08/100
- National rank
- #5025
- State rank
- #534 of 656 in OH
Livability — Marietta
- Score
- 80/100
- State rank
- #127
- US rank
- #1845
Category grades
Schools grade is shown separately in the Schools card above.
Census & demographics
- Census place
- Marietta, OH
- County
- Washington County · 26,420 people
- City population
- 26,420
- Metro
- Marietta, OH
- Population (ZIP)
- 26,420
- Household income
- $60,229
- Rent vs Own
- Severe rent burden
- 727.0
Population outlook (Washington County) Hauer SSP2
- Today (2025)
- 59,640 people
- By 2030
- 58,315 · -2.2%
- By 2040
- 55,186 · -7.5%
- By 2050
- 52,246 · -12.4%
- By 2075
- 45,893 · -23.0%
- By 2100
- 38,128 · -36.1%
Race, ethnicity, and origin ACS 2023
- Neighborhood character
- Predominantly White (94%)
- Race & ethnicity
- White 94% Two or more races 2% Asian 1% Black 1% Hispanic / Latino 1%
- Common ancestry
- Italian 2% Slovak 2% Romanian 2%
- Foreign-born
- 2% · Canada
- Languages at home
- 97% English-only · Tagalog/Filipino 1% Other Indo-European 1%
Political lean MEDSL · Washington
- 2024 margin
- Solid R (+43.8) · D 27.7% · R 71.5%
- 2008→2024 swing
- +40.2pp toward D · 2008: -83.9pp · 2024: -43.8pp
- All cycles
- 2024: R+43.8 2020: R+40.8 2016: R+41.6 2012: R+19.4 2008: R+83.9
Not yet ingested
- Civics
- —
Market trends
- HPI YoY
- ▼ -95.06%
- Current HPI
- 198.6235
- Rent YoY
- —
- Metro
- Marietta, OH
- State GDP YoY
- ▲ 1.98%
- F500 in state
- 48
Industry mix (Fortune 500 HQ in OH)
| Industry | F500 HQs | Revenue |
|---|---|---|
| Insurance | 3 | $145B |
|
||
| Industrial Machinery | 3 | $49B |
|
||
| Financial Services | 3 | $24B |
|
||
| Consumer Goods | 2 | $93B |
|
||
| Aerospace / Defense | 2 | $47B |
|
||
| Utilities | 2 | $33B |
|
||
Price history
+64.1% since first listed2 events — show timeline
- 2026-06-18 Listed $52,500 MLSNOW
- 1988-06-22 Sold (Public Records) $32,000 Public Records
Property tax history
+10.3%/yrLatest (2025): $972 · -10.9% YoY. Source: county tax records.
Cash-flow waterfall
monthlySold comps — $/sqft
last 12 mo · ≤1 miLoading sold comps…