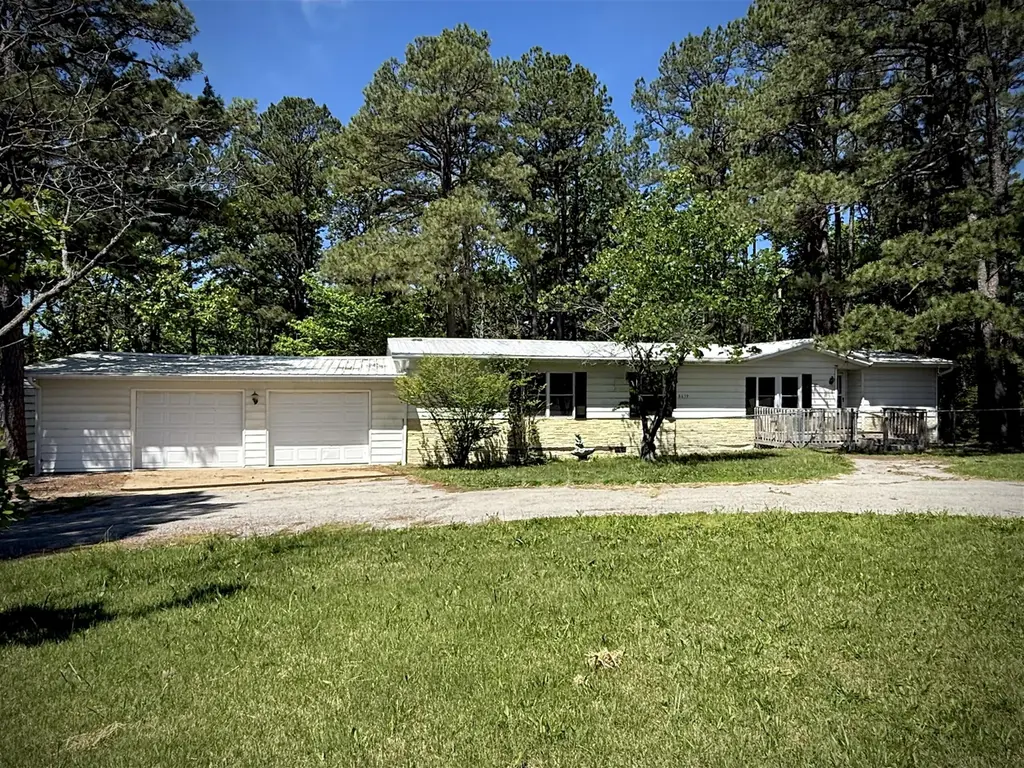
8639 Highway E
Houston, MO 65483
$168,000F
3 bd · 2.0 ba ·
1,642 sqft ·
Built 1979
· Other
· Active
· 50 DOM
Cashflow @ list (25.0% down · 7.5%)
Estimated rent
$1,195/mo
Mortgage (P&I)
−$881
Tax + insurance
−$120
HOA
−$0
Vac / Maint / Mgmt
−$251
Net cashflow
$-57/mo
Annual
$-681/yr
Cap rate
5.89%
Cash-on-cash
-1.45%
DSCR
0.94
1% rule
0.71%
Cash to close
$47,040
Investor read
- This is a 3-bed/2.0-bath other listed at $168k.
- At list price, monthly cash flow is $-57 ($-681/yr) — negative.
- To cash-flow at today's rent, offer at most $158k (6.0% below list).
- To meet the 1% rule (rent ≥ 1% of price), the offer needs to be $119k (28.9% below list).
- It's been on market 50 days — a 3% lower offer ($163k) is reasonable based on typical stale-listing flexibility.
- Recommended offer: $119k (28.9% below list) — sets the bar for 1% rule.
- Local home prices are declining (-3.0%/yr); year-one equity from $1k of loan paydown is wiped out by about $5k of value loss. Plan a longer hold.
- Location reads 53/100 on livability (#824 in MO) — a working-class tenant base; expect higher turnover. Strengths: cost of living A+, housing B; Watch: crime F, amenities F, commute F.
- Houston R-I (rural): math 24% / reading 39% proficiency, ranked #266 of 324 in MO (top 82%) — families likely to look elsewhere, expect single-tenant / working-renter base with shorter leases.
- Zoned schools: Houston Elem. (math 34% / reading 39%, grade F, #656 of 1,115 statewide, top 59%, 432 students, 55% FRL); Houston Middle (math 20% / reading 34%, grade F, #306 of 391 statewide, top 80%, 206 students, 55% FRL); Houston High (math 12% / reading 52%, grade F, #356 of 521 statewide, top 71%, 374 students, 41% FRL) — zoned schools at 50% FRL track the district average.
- Market conditions: 90 active listings in the ZIP; 10 units permitted in Texas County in 2024 (5 in 5+ unit buildings).
- Texas County population projected at -11% by 2050 — secular population decline; favor cash flow + early exit over multi-decade hold.
- Climate carrying-cost: moderate wildfire risk — expect insurance premiums to compound above CPI over the hold.
- Cap rate 5.9% vs local median 4.0% in Houston — top-decile yield for the area; either an underpriced asset or a hidden risk that comps aren't pricing in. Stress-test before assuming the spread holds.
Questions for listing agent
- What do current leases actually rent for vs. the listed asking? Can we see a recent rent roll and the last 12 months of T-12 income?
- It's been on market 50 days. Have you received any prior offers? Is the seller open to a 29% concession, seller financing, or rate buy-down credit?
- Built in 1979 — when were the roof, HVAC, electrical panel, plumbing, and water heater last replaced?
- Is there a deadline driving the sale (1031 exchange, divorce, estate, relocation)? That informs how much negotiation room exists.
- Schools are D-rated, which usually means shorter tenancies and higher turnover. Who's the typical renter profile here, and what's been the actual vacancy rate?
- Crime grade is F in this area — have there been break-ins, vandalism, or insurance claims at this property in the last 3 years? What carrier currently insures it and at what premium?
- The area grade is low — what's the realistic commute time and amenity access for the typical tenant pool here? Any planned neighborhood developments (good or bad) we should know about?
- What's the average days-on-market for RENTAL listings here right now (not sales)? A rising rental-DOM trend means longer vacancies and softer asking-rent achievability than the comps imply.
CashFlowRE · CFR-JGC87A6B6ZWQAC
· Data 3 h ago
cashflowre.app · 2026-05-29