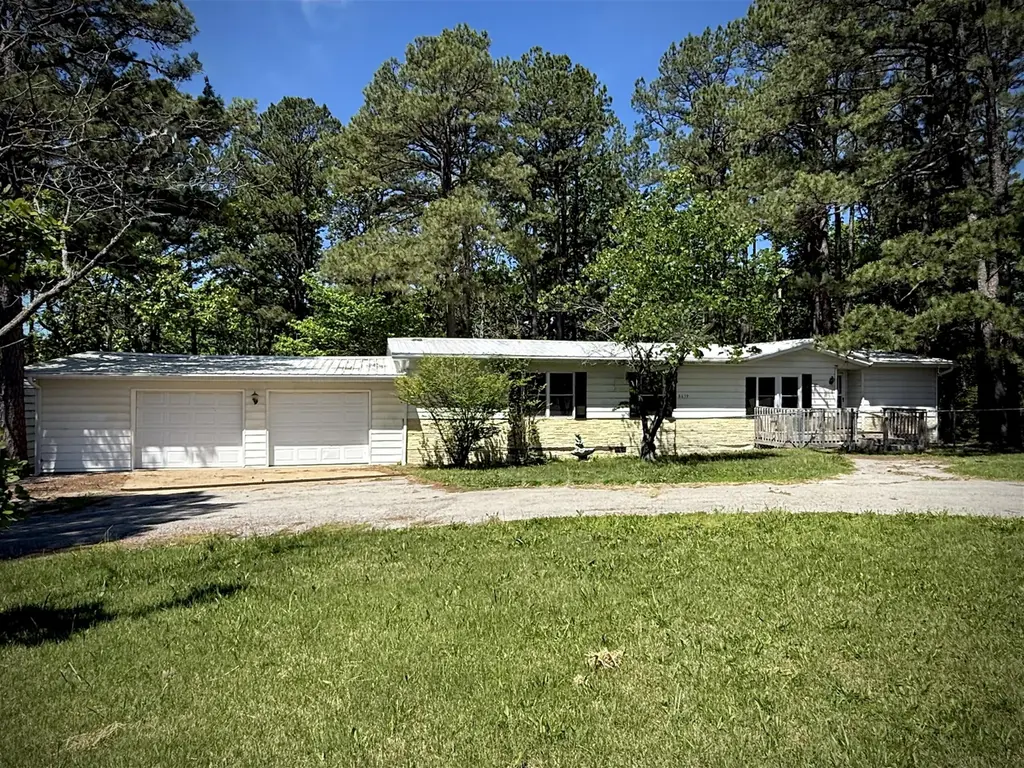
8639 Highway E · Houston, MO
Flood risk 1/10 · Minimal
- FEMA flood zone
- —
- Chance of flooding over 30 yrs
- 0.0%
- Est. flood insurance / yr
- —
Fire risk 5/10 · Moderate
- Est. fire insurance / yr
- $1,054 – $1,958
Heat risk 4/10 · Minor
- Hot days now (above 105°F)
- 7 days/yr
- Hot days in 30 yrs
- 19 days/yr
Wind risk 2/10 · Minimal
- Chance of severe wind over 30 yrs
- 0.0%
Air-quality risk 1/10 · Minimal
- Unhealthy air days now
- 0 days/yr
- Unhealthy air days in 30 yrs
- 0 days/yr
Risk factors via First Street. Map © Google.
Why this score? — see what drove the F grade
The composite is a weighted blend of 9 inputs, each scored 0–100. Each bar is that input's sub-score; the figure is the points it added to the 100-point composite (weight × sub-score).
- Cash flow +11.5/30.0
- ARV discount +7.5/15.0
- DSCR +3.4/10.0
- Livability +2.7/5.0
- Schools +2.6/10.0
- Rent growth +2.5/5.0
- Condition / age +2.5/5.0
- 1% rule +2.1/10.0
- Appreciation +0.0/10.0
$168,000
🖨 Deal sheet (PDF) 📄 Offer letter ✓ Due diligence
Listing remarks
Welcome home to this spacious and thoughtfully updated 3 bedroom, 2 bath manufactured home with a well-designed addition. Ideally located outside city limits of Houston, but within minutes of town. Step inside to find fresh updates throughout, including new flooring, fresh paint, and stylish fixtures for a move-in ready feel. The heart of the home is a massive cook's kitchen featuring a center island, abundant oak cabinetry and Frigidaire stainless steel appliances - perfect for entertaining or everyday living. A large dining room with built-in cabinet provides an inviting space for gatherings. With two separate living areas, there's plenty of room to spread out, relax or host guests. Car e
Key facts
- 0.56 acre lot
- 4 garage spots
- Built 1979
Property features AI
Finance
- Other: Lot is level with few trees; Asphalt road frontage on a highway; Lot size approximately 0.56 acre; Directions: North of Houston on Hwy 63, take Highway E to property approximately 1/4 mile on the left.
Exterior
- Parking: 4-car garage; Circular driveway; Paved parking; Garage faces front; Garage door opener; Workshop in garage
- Utilities: Propane; Septic tank; Other water source
- Home design: Manufactured home (double wide) on land; Residential property
- Construction: Aluminum siding; Metal roof; Manufactured house construction
- Exterior features: Rain gutters; Front porch; Rear porch; Partial chain link fencing; Workshop (separate structure)
Interior
- Kitchen: Electric oven; Free-standing electric oven; Dishwasher; Microwave; Refrigerator
- Flooring: Laminate
- Bathrooms: 2 full bathrooms
- Heating & cooling: Central air conditioning; Electric heating; Propane heating; Forced air heating
- Interior features: Kitchen island; Living room fireplace
- Laundry & utility: Laundry on main level
Neighborhood map
What this means for you Summary
Snapshot
- This is a 3-bed/2.0-bath other listed at $168k.
Deal economics
- At list price, monthly cash flow is $-57 ($-681/yr) — negative.
- To cash-flow at today's rent, offer at most $158k (6.0% below list).
- To meet the 1% rule (rent ≥ 1% of price), the offer needs to be $119k (28.9% below list).
- Recommended offer: $119k (28.9% below list) — sets the bar for 1% rule.
- Cap rate 5.9% vs local median 4.0% in Houston — top-decile yield for the area; either an underpriced asset or a hidden risk that comps aren't pricing in. Stress-test before assuming the spread holds.
Location & tenants
- Location reads 53/100 on livability (#824 in MO) — a working-class tenant base; expect higher turnover. Strengths: cost of living A+, housing B; Watch: crime F, amenities F, commute F.
- Houston R-I (rural): math 24% / reading 39% proficiency, ranked #266 of 324 in MO (top 82%) — families likely to look elsewhere, expect single-tenant / working-renter base with shorter leases.
- Zoned schools: Houston Elem. (math 34% / reading 39%, grade F, #656 of 1,115 statewide, top 59%, 432 students, 55% FRL); Houston Middle (math 20% / reading 34%, grade F, #306 of 391 statewide, top 80%, 206 students, 55% FRL); Houston High (math 12% / reading 52%, grade F, #356 of 521 statewide, top 71%, 374 students, 41% FRL) — zoned schools at 50% FRL track the district average.
- Market conditions: 90 active listings in the ZIP; 10 units permitted in Texas County in 2024 (5 in 5+ unit buildings).
Forward outlook
- Local home prices are declining (-3.0%/yr); year-one equity from $1k of loan paydown is wiped out by about $5k of value loss. Plan a longer hold.
- Texas County population projected at -11% by 2050 — secular population decline; favor cash flow + early exit over multi-decade hold.
Negotiation context
- It's been on market 50 days — a 3% lower offer ($163k) is reasonable based on typical stale-listing flexibility.
Risks & watch-outs
- Climate carrying-cost: moderate wildfire risk — expect insurance premiums to compound above CPI over the hold.
Questions for the listing agent
- What do current leases actually rent for vs. the listed asking? Can we see a recent rent roll and the last 12 months of T-12 income?
- It's been on market 50 days. Have you received any prior offers? Is the seller open to a 29% concession, seller financing, or rate buy-down credit?
- Built in 1979 — when were the roof, HVAC, electrical panel, plumbing, and water heater last replaced?
- Is there a deadline driving the sale (1031 exchange, divorce, estate, relocation)? That informs how much negotiation room exists.
- Schools are D-rated, which usually means shorter tenancies and higher turnover. Who's the typical renter profile here, and what's been the actual vacancy rate?
- Crime grade is F in this area — have there been break-ins, vandalism, or insurance claims at this property in the last 3 years? What carrier currently insures it and at what premium?
- The area grade is low — what's the realistic commute time and amenity access for the typical tenant pool here? Any planned neighborhood developments (good or bad) we should know about?
- What's the average days-on-market for RENTAL listings here right now (not sales)? A rising rental-DOM trend means longer vacancies and softer asking-rent achievability than the comps imply.
- What's the recent tenant-quality profile in this submarket — average credit score on applications, eviction rate, late-payment / NSF rate, and stable-employment percentage? A property-management company in the area should have these aggregated.
- How much new for-sale + rental construction is in the pipeline within 1–3 miles? Heavy new supply typically softens prices + rents 12–24 months out; constrained supply supports both.
Investment metrics
- 1% rule
- 0.71% ✗
- Cap rate
- 5.89%
- Cash-on-cash
- -1.45%
- DSCR
- 0.94
- GRM
- 11.7
CMA / ARV
No comps found within radius.
Projected returns pro-forma
-3.0% appreciation · 3.0% rent growth · sell at horizon
- IRR
- -18.8%
- Equity multiple
- 0.34×
- Total profit
- $-30,918
- Equity at exit
- $25,049
- IRR
- -11.3%
- Equity multiple
- 0.32×
- Total profit
- $-31,904
- Equity at exit
- $14,526
Cash invested: $47,040 (down + closing). Projections, not guarantees.
Landlord ↔ Tenant lean methodology
- Overall (STATE)
- 81 Strongly Landlord-Friendly
- State Missouri
- 81 Strongly Landlord-Friendly · R+10
- County
- — inherits STATE
- City
- — inherits STATE
ZIP-level market 65483
- Home prices YoY
- -8.5%
- Active inventory
- 90
- Price-to-rent
- 11.7×
Monthly cashflow live
- Estimated rent
- $1,195 medium interval (Pro) →
- Mortgage (P&I)
- −$881
- Tax from tax record
- −$50 /mo · $594/yr
- Insurance
- −$70
- HOA
- −$0
- Vacancy / Maint / Mgmt
- −$251
- Net cashflow
- $-57
Break-even live
Sensitivity live
| Price | -10% $38 | -5% $-9 | +0% $-57 | +5% $-104 | +10% $-152 |
|---|---|---|---|---|---|
| Rent | -10% $-151 | -5% $-104 | +0% $-57 | +5% $-10 | +10% $38 |
| Rate | -1.0pp $28 | -0.5pp $-14 | base $-57 | +0.5pp $-100 | +1.0pp $-145 |
UW: 25.0% down · 7.5% · 30yr · 1.5% tax · 5.0% vac · 8.0% maint · 8.0% mgmt
Financing live
Cash to close
- Down payment
- $42,000
- Closing costs
- $5,040
- Reserves months
- —
- Total cash needed
- —
Loan-product check · same deal, 3 products live
Conventional
25% down · 7.5% · 30yr
- Down + closing
- —
- Monthly P&I
- —
- Monthly cashflow
- —
- DSCR
- —
- Eligible?
- —
Personal DTI + credit; lowest rate.
DSCR
20% down · 8.5% · 30yr
- Down + closing
- —
- Monthly P&I
- —
- Monthly cashflow
- —
- DSCR
- —
- Eligible?
- —
No personal income docs; deal must DSCR.
Hard money
10% down · 12.0% · 12mo
- Down + closing
- —
- Monthly P&I
- —
- Monthly cashflow
- —
- DSCR
- —
- Eligible?
- —
Short-term bridge; refi at stabilization.
Listing history 18 events
-
2026-06-22days on market $168,000 Active 50 DOM
-
2026-06-21days on market $168,000 Active 49 DOM
-
2026-06-21days on market $168,000 Active 48 DOM
-
2026-06-18days on market $168,000 Active 46 DOM
-
2026-06-17days on market $168,000 Active 45 DOM
-
2026-06-16days on market $168,000 Active 44 DOM
-
2026-06-15days on market $168,000 Active 43 DOM
-
2026-06-13days on market $168,000 Active 41 DOM
-
2026-06-12days on market $168,000 Active 40 DOM
-
2026-06-09days on market $168,000 Active 37 DOM
-
2026-06-08days on market $168,000 Active 36 DOM
-
2026-06-07days on market $168,000 Active 35 DOM
-
2026-06-07days on market $168,000 Active 34 DOM
-
2026-06-04days on market $168,000 Active 31 DOM
-
2026-06-02days on market $168,000 Active 30 DOM
-
2026-06-01days on market $168,000 Active 29 DOM
-
2026-05-31days on market $168,000 Active 28 DOM
-
2026-05-02$179,000 Active 1106-char remark
ⓘ Source: listings_history table (triggers on properties + properties_extension) + one-shot
backfill from property_details.listing_events for pre-trigger history.
Tax reassessment forecast MO · Resets to sale price
- Current annual tax
- $594 · $50/mo
- Projected year-2 tax
- $1,630 · $136/mo
- Expected delta
- +$1,036/yr (+$86/mo · 174.3%)
ⓘ Screening estimate from a state-policy table — verify with the county assessor before closing.
Climate risk First Street
- Flood 1/10 Low 0% chance over 30 yrs
- Wildfire 5/10 Major
- Heat 4/10 Moderate 7 d/yr ≥105°F today · 19 d/yr by 30 yrs out
- Wind 2/10 Low 0% chance of damaging wind over 30 yrs
- Air quality 1/10 Low 0 unhealthy d/yr today · 0 by 30 yrs out
Nearby sold comps map
Loading sold comps map…
Walkable amenities ~0.75 mi
Loading nearby amenities…
Taxation est. · year 1
- Rental income
- $14,336
- − Mortgage interest
- −$9,411
- − Property taxes
- −$594
- − Insurance
- −$840
- − Repairs & maintenance
- −$1,147
- − Management
- −$1,147
- − Depreciation
- −$4,887
- Taxable loss
- −$3,690
- Est. tax savings @ 24.0%
- +$886
- After-tax cash flow
- $205/yr
For passive investors: Depreciation is non-cash, so a rental often shows a tax loss while cash-flowing — sheltering income. Rental losses are passive: they offset passive income freely, and up to $25,000/yr can offset ordinary (W-2) income if you actively participate and your MAGI is under $100k (phasing out to $0 by $150k); unused losses carry forward. On sale, claimed depreciation is recaptured at up to 25%, and gains may owe capital-gains tax (a 1031 exchange can defer both). Figures are a year-1 estimate at your 24.0% rate — not tax advice; consult a CPA.
Schools (NCES district)
- District
- Houston R-I
- NCES district ID
- 2914840
- Math proficiency
- 24% ▼ -2.00%
- Reading proficiency
- 39% ▬ 0.00%
- Median HH income
- $34,169
- Composite
- 25.88/100
- National rank
- #7344
- State rank
- #266 of 324 in MO
Livability — Houston
- Score
- 53/100
- State rank
- #824
- US rank
- #24484
Category grades
Schools grade is shown separately in the Schools card above.
Census & demographics
- Population (ZIP)
- 4,607
Population outlook (Texas County) Hauer SSP2
- Today (2025)
- 24,648 people
- By 2030
- 23,981 · -2.7%
- By 2040
- 22,840 · -7.3%
- By 2050
- 21,832 · -11.4%
- By 2075
- 19,481 · -21.0%
- By 2100
- 16,634 · -32.5%
Race, ethnicity, and origin ACS 2023
- Neighborhood character
- Predominantly White (93%)
- Race & ethnicity
- White 93% Two or more races 4% Hispanic / Latino 2%
- Common ancestry
- Slovak 3% Danish 2% Iranian 2%
- Foreign-born
- 0%
- Languages at home
- 98% English-only · Tagalog/Filipino 1% German/W. Germanic 1%
Political lean MEDSL · Texas
- 2024 margin
- Solid R (+71.7) · D 13.8% · R 85.5%
- 2008→2024 swing
- -36.7pp toward R · 2008: -35.1pp · 2024: -71.7pp
- All cycles
- 2024: R+71.7 2020: R+68.6 2016: R+65.4 2012: R+44.1 2008: R+35.1
Not yet ingested
- Civics
- —
Market trends
- HPI YoY
- ▼ -20.78%
- Current HPI
- 224.0504
- Rent YoY
- —
- Metro
- —
- State GDP YoY
- ▲ 1.84%
- F500 in state
- 20
Industry mix (Fortune 500 HQ in MO)
| Industry | F500 HQs | Revenue |
|---|---|---|
| Healthcare | 1 | $163B |
|
||
| Insurance | 1 | $21B |
|
||
| Industrial Technology | 1 | $17B |
|
||
| Retail | 1 | $16B |
|
||
| Industrial Distribution | 1 | $10B |
|
||
| Utilities | 1 | $9B |
|
||
Price history
-6.1% since first listed2 events — show timeline
- 2026-05-28 Price Changed $168,000 SOMO
- 2026-05-02 Listed $179,000 SOMO
Property tax history
+4.8%/yrLatest (2025): $594 · +7.6% YoY. Source: county tax records.
Cash-flow waterfall
monthlySold comps — $/sqft
last 12 mo · ≤1 miLoading sold comps…