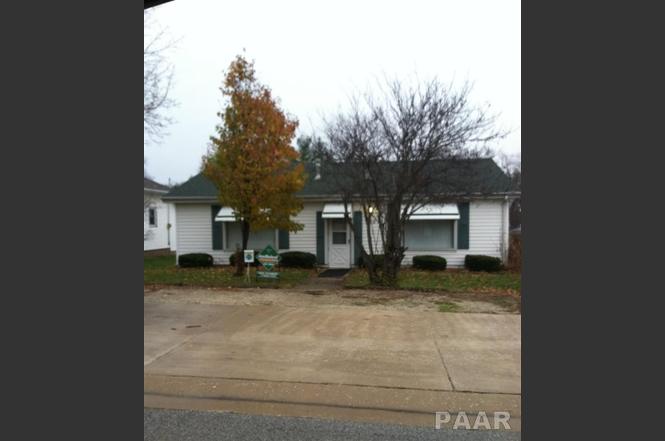
306 S Main St
Bellevue, IL 61604
$119,900B-
3 bd · 1.5 ba ·
1,280 sqft ·
Built 1940
· SingleFamily
· Pending
· 1 DOM
Cashflow @ list (25.0% down · 7.5%)
Estimated rent
$1,362/mo
Mortgage (P&I)
−$629
Tax + insurance
−$175
HOA
−$0
Vac / Maint / Mgmt
−$286
Net cashflow
$272/mo
Annual
$3,266/yr
Cap rate
9.02%
Cash-on-cash
9.73%
DSCR
1.43
1% rule
1.14%
Cash to close
$33,572
Investor read
- This is a 3-bed/1.5-bath single-family listed at $120k.
- At list price, monthly cash flow is $272 ($3k/yr) — positive.
- The deal already cash-flows at list — no discount required.
- Meets the 1% rule at list price ($1k rent vs $120k).
- Only 1 days on market — expect competitive offers; lowballing is unlikely to land.
- Local home prices are declining (-3.0%/yr); year-one equity from $829 of loan paydown is wiped out by about $4k of value loss. Plan a longer hold.
- Location reads 65/100 on livability (#601 in IL) — a middle-class / working-renter tenant base. Strengths: crime A+, cost of living A+, housing A+; Watch: employment C-, amenities F, commute F.
- Limestone Chsd 310 (rural): math 25% / reading 35% proficiency, ranked #486 of 919 in IL (top 53%) — families likely to look elsewhere, expect single-tenant / working-renter base with shorter leases.
- Zoned schools: Norwood Primary School (math 12% / reading 22%, grade F, #1,141 of 2,056 statewide, top 59%, 235 students, 0% FRL); Norwood Elem School (math 8% / reading 17%, grade F, #550 of 665 statewide, top 84%, 165 students, 0% FRL); Limestone Community High School (math 17% / reading 22%, grade F, #397 of 693 statewide, top 61%, 924 students, 0% FRL).
- Zoned-school proficiency averages 16% at this address vs 30% district-wide (-14 pts) — the specific schools serving this property underperform the Limestone Chsd 310 average; the district grade overstates school quality for this exact location.
- Watch-outs: built in 1940 — expect roof / HVAC / electrical / plumbing capex.
- Market conditions: Rents rising (+2.3%/yr); 180 active listings in the ZIP; 73 units permitted in Peoria County in 2024 (0 in 5+ unit buildings).
- Peoria County population projected at -11% by 2050 — secular population decline; favor cash flow + early exit over multi-decade hold.
- Current owner paid $56k; list at $120k implies a 114% gain — meaningful room to come down on a strong offer.
- This rent runs 31% of the median local income ($52k/yr) — at the standard rent-burdened threshold; future hikes will face affordability resistance.
Questions for listing agent
- Built in 1940 — when were the roof, HVAC, electrical panel, plumbing, and water heater last replaced?
- Is there a deadline driving the sale (1031 exchange, divorce, estate, relocation)? That informs how much negotiation room exists.
- Schools are D-rated, which usually means shorter tenancies and higher turnover. Who's the typical renter profile here, and what's been the actual vacancy rate?
- What's the average days-on-market for RENTAL listings here right now (not sales)? A rising rental-DOM trend means longer vacancies and softer asking-rent achievability than the comps imply.
- What's the recent tenant-quality profile in this submarket — average credit score on applications, eviction rate, late-payment / NSF rate, and stable-employment percentage? A property-management company in the area should have these aggregated.
- How much new for-sale + rental construction is in the pipeline within 1–3 miles? Heavy new supply typically softens prices + rents 12–24 months out; constrained supply supports both.
CashFlowRE · CFR-JGXZZ9119WNP5A
· Data 15 h ago
cashflowre.app · 2026-05-29