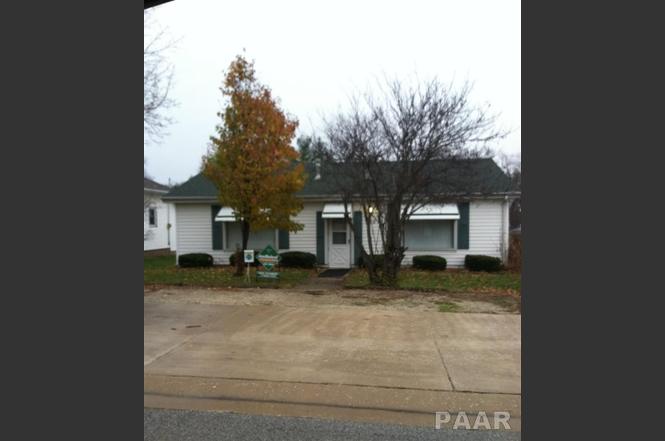
306 S Main St · Bellevue, IL
Flood risk 1/10 · Minimal
- FEMA flood zone
- —
- Chance of flooding over 30 yrs
- 0.0%
- Est. flood insurance / yr
- —
Fire risk 1/10 · Minimal
- Est. fire insurance / yr
- $804 – $1,492
Heat risk 3/10 · Minor
- Hot days now (above 105°F)
- 7 days/yr
- Hot days in 30 yrs
- 18 days/yr
Wind risk 2/10 · Minimal
- Chance of severe wind over 30 yrs
- 1.0%
Air-quality risk 3/10 · Minor
- Unhealthy air days now
- 1 days/yr
- Unhealthy air days in 30 yrs
- 3 days/yr
Risk factors via First Street. Map © Google.
Why this score? — see what drove the B- grade
The composite is a weighted blend of 9 inputs, each scored 0–100. Each bar is that input's sub-score; the figure is the points it added to the 100-point composite (weight × sub-score).
- Cash flow +25.3/30.0
- ARV discount +15.0/15.0
- DSCR +8.3/10.0
- 1% rule +6.4/10.0
- Livability +3.2/5.0
- Rent growth +3.1/5.0
- Schools +2.9/10.0
- Condition / age +2.5/5.0
- Appreciation +0.0/10.0
$119,900
🖨 Deal sheet (PDF) 📄 Offer letter ✓ Due diligence
Listing remarks
Move-in ready and exceptionally well maintained, this charming 3-bedroom ranch in Bellevue is ready for its next owner! Offering comfortable one-level living, this home features a bright and inviting interior with appliances included, making your move even easier. Numerous major updates have already been completed, including windows 22', luxury vinyl flooring 25', HVAC 24', water heater 24', opened ceiling in living room, new plaster, cabinets & counter top 24', roof, approx 14', Whether you're a first-time homebuyer, downsizing, or looking for a turnkey investment, this property checks all the boxes. Outside, you'll appreciate the convenience of four off-street parking spaces located
Key facts
- One-level living
- Appliances included
- 7,840 sq ft lot
Tags
Property features AI
Exterior
- Parking: No garage; paved parking
- Utilities: Public water; Public sewer
- Home design: Single-family residence; Living area approximately 1280
- Construction: Shingle roof; Built in 1940
- Exterior features: Shed(s); Level lot; Paved road access
Interior
- Kitchen: Refrigerator
- Bedrooms: Three bedrooms (bedroom sizes: primary approx. 15.7 x 10.7 ft; second approx. 10.7 x 9.2 ft; third approx. 10.6 x 9.6 ft)
- Flooring: Carpet in primary bedroom; Vinyl flooring in other main-level living areas and bedrooms
- Bathrooms: One full bathroom
- Heating & cooling: Central air conditioning; Forced air heating
- Interior features: Cable available
- Laundry & utility: Washer and dryer; Dedicated laundry room (approx. 13.5 x 5.9 ft)
Neighborhood map
What this means for you Summary
Snapshot
- This is a 3-bed/1.5-bath single-family listed at $120k.
Deal economics
- At list price, monthly cash flow is $272 ($3k/yr) — positive.
- The deal already cash-flows at list — no discount required.
- Meets the 1% rule at list price ($1k rent vs $120k).
Location & tenants
- Location reads 65/100 on livability (#601 in IL) — a middle-class / working-renter tenant base. Strengths: crime A+, cost of living A+, housing A+; Watch: employment C-, amenities F, commute F.
- Limestone Chsd 310 (rural): math 25% / reading 35% proficiency, ranked #486 of 919 in IL (top 53%) — families likely to look elsewhere, expect single-tenant / working-renter base with shorter leases.
- Zoned schools: Norwood Primary School (math 12% / reading 22%, grade F, #1,141 of 2,056 statewide, top 59%, 235 students, 0% FRL); Norwood Elem School (math 8% / reading 17%, grade F, #550 of 665 statewide, top 84%, 165 students, 0% FRL); Limestone Community High School (math 17% / reading 22%, grade F, #397 of 693 statewide, top 61%, 924 students, 0% FRL).
- Zoned-school proficiency averages 16% at this address vs 30% district-wide (-14 pts) — the specific schools serving this property underperform the Limestone Chsd 310 average; the district grade overstates school quality for this exact location.
- Market conditions: Rents rising (+2.3%/yr); 180 active listings in the ZIP; 73 units permitted in Peoria County in 2024 (0 in 5+ unit buildings).
- This rent runs 31% of the median local income ($52k/yr) — at the standard rent-burdened threshold; future hikes will face affordability resistance.
Forward outlook
- Local home prices are declining (-3.0%/yr); year-one equity from $829 of loan paydown is wiped out by about $4k of value loss. Plan a longer hold.
- Peoria County population projected at -11% by 2050 — secular population decline; favor cash flow + early exit over multi-decade hold.
Negotiation context
- Only 1 days on market — expect competitive offers; lowballing is unlikely to land.
- Current owner paid $56k; list at $120k implies a 114% gain — meaningful room to come down on a strong offer.
Risks & watch-outs
- Watch-outs: built in 1940 — expect roof / HVAC / electrical / plumbing capex.
Questions for the listing agent
- Built in 1940 — when were the roof, HVAC, electrical panel, plumbing, and water heater last replaced?
- Is there a deadline driving the sale (1031 exchange, divorce, estate, relocation)? That informs how much negotiation room exists.
- Schools are D-rated, which usually means shorter tenancies and higher turnover. Who's the typical renter profile here, and what's been the actual vacancy rate?
- What's the average days-on-market for RENTAL listings here right now (not sales)? A rising rental-DOM trend means longer vacancies and softer asking-rent achievability than the comps imply.
- What's the recent tenant-quality profile in this submarket — average credit score on applications, eviction rate, late-payment / NSF rate, and stable-employment percentage? A property-management company in the area should have these aggregated.
- How much new for-sale + rental construction is in the pipeline within 1–3 miles? Heavy new supply typically softens prices + rents 12–24 months out; constrained supply supports both.
Investment metrics
- 1% rule
- 1.14% ✓
- Cap rate
- 9.02%
- Cash-on-cash
- 9.73%
- DSCR
- 1.43
- GRM
- 7.3
CMA / ARV
- ARV (on-the-fly)
- $149,760
- Comps found
- 12
Show comp detail 12 sales within ~0.75 mi
| Address | Dist | Beds/Ba | Sqft | Sold | Price | $/sf | Match |
|---|---|---|---|---|---|---|---|
| 316 S Limestone Ave | 0.08mi | 4/1.0 (+1) | 1,326 (+4%) | 1mo | $130,000 | $98 | 83 |
| 406 S Limestone Ave | 0.10mi | 3/2.0 | 1,320 (+3%) | 16mo | $175,000 | $133 | 75 |
| 222 S Main St | 0.03mi | 3/1.0 | 1,123 (-12%) | 5mo | $91,000 | $81 | 72 |
| 213 N Eisele Dr | 0.43mi | 3/1.0 | 1,248 (-2%) | 6mo | $130,000 | $104 | 68 |
| 5610 W Overland Pass | 0.59mi | 3/1.0 | 1,308 (+2%) | 3mo | $189,900 | $145 | 64 |
| 1015 S Mesa Dr | 0.60mi | 3/1.5 | 1,287 (+0%) | 12mo | $208,500 | $162 | 61 |
| 537 S Byron Ct | 0.37mi | 2/1.0 (-1) | 1,383 (+8%) | 6mo | $95,000 | $69 | 57 |
| 622 S Byron Ct | 0.46mi | 3/1.5 | 1,381 (+8%) | 13mo | $161,700 | $117 | 54 |
| 4823 W Closen Ave | 0.53mi | 3/2.0 | 1,164 (-9%) | 9mo | $135,000 | $116 | 50 |
| 625 N Tower Rd | 0.67mi | 2/1.0 (-1) | 1,278 (-0%) | 16mo | $144,900 | $113 | 48 |
| 5624 W Cherokee Path | 0.69mi | 2/2.0 (-1) | 1,188 (-7%) | 7mo | $190,000 | $160 | 43 |
| 5720 W Colt Dr | 0.61mi | 3/1.0 | 1,120 (-12%) | 15mo | $155,900 | $139 | 36 |
Match score weights: distance 35% · size 25% · config 20% · recency 20%. Top-matched comps best support the ARV.
Projected returns pro-forma
-3.0% appreciation · 2.3% rent growth · sell at horizon
- IRR
- -2.4%
- Equity multiple
- 0.91×
- Total profit
- $-3,041
- Equity at exit
- $17,877
- IRR
- 6.5%
- Equity multiple
- 1.47×
- Total profit
- $15,841
- Equity at exit
- $10,367
Cash invested: $33,572 (down + closing). Projections, not guarantees.
Landlord ↔ Tenant lean methodology
- Overall (STATE)
- 43 Moderately Tenant-Leaning
- State Illinois
- 43 Moderately Tenant-Leaning · D+7
- County
- — inherits STATE
- City
- — inherits STATE
ZIP-level market 61604
- Home prices YoY
- -24.6%
- Rents YoY
- 2.3%
- Active inventory
- 180
- Price-to-rent
- 7.3×
Monthly cashflow live
- Estimated rent
- $1,362 medium interval (Pro) →
- Mortgage (P&I)
- −$629
- Tax from tax record
- −$125 /mo · $1,497/yr
- Insurance
- −$50
- HOA
- −$0
- Vacancy / Maint / Mgmt
- −$286
- Net cashflow
- $272
Break-even live
Sensitivity live
| Price | -10% $340 | -5% $306 | +0% $272 | +5% $238 | +10% $204 |
|---|---|---|---|---|---|
| Rent | -10% $165 | -5% $218 | +0% $272 | +5% $326 | +10% $380 |
| Rate | -1.0pp $333 | -0.5pp $303 | base $272 | +0.5pp $241 | +1.0pp $209 |
UW: 25.0% down · 7.5% · 30yr · 1.5% tax · 5.0% vac · 8.0% maint · 8.0% mgmt
Financing live
Cash to close
- Down payment
- $29,975
- Closing costs
- $3,597
- Reserves months
- —
- Total cash needed
- —
Loan-product check · same deal, 3 products live
Conventional
25% down · 7.5% · 30yr
- Down + closing
- —
- Monthly P&I
- —
- Monthly cashflow
- —
- DSCR
- —
- Eligible?
- —
Personal DTI + credit; lowest rate.
DSCR
20% down · 8.5% · 30yr
- Down + closing
- —
- Monthly P&I
- —
- Monthly cashflow
- —
- DSCR
- —
- Eligible?
- —
No personal income docs; deal must DSCR.
Hard money
10% down · 12.0% · 12mo
- Down + closing
- —
- Monthly P&I
- —
- Monthly cashflow
- —
- DSCR
- —
- Eligible?
- —
Short-term bridge; refi at stabilization.
Listing history 9 events
-
2026-06-21status $119,900 Pending 1 DOM
-
2026-06-18statusdays on market $119,900 Active 1 DOM
-
2026-06-18days on market $119,900 Coming Soon 7 DOM
-
2026-06-17days on market $119,900 Coming Soon 6 DOM
-
2026-06-16days on market $119,900 Coming Soon 5 DOM
-
2026-06-15days on market $119,900 Coming Soon 4 DOM
-
2026-06-14days on market $119,900 Coming Soon 2 DOM
-
2026-06-13remarks 695-char remark
-
2026-06-13$119,900 Coming Soon 1 DOM
ⓘ Source: listings_history table (triggers on properties + properties_extension) + one-shot
backfill from property_details.listing_events for pre-trigger history.
Tax reassessment forecast IL · Partial reset (capped growth)
- Current annual tax
- $1,497 · $125/mo
- Projected year-2 tax
- $2,109 · $176/mo
- Expected delta
- +$612/yr (+$51/mo · 40.9%)
ⓘ Screening estimate from a state-policy table — verify with the county assessor before closing.
Climate risk First Street
- Flood 1/10 Low 0% chance over 30 yrs
- Wildfire 1/10 Low
- Heat 3/10 Moderate 7 d/yr ≥105°F today · 18 d/yr by 30 yrs out
- Wind 2/10 Low 100% chance of damaging wind over 30 yrs
- Air quality 3/10 Moderate 1 unhealthy d/yr today · 3 by 30 yrs out
Nearby sold comps map
Loading sold comps map…
Walkable amenities ~0.75 mi
Loading nearby amenities…
Taxation est. · year 1
- Rental income
- $16,339
- − Mortgage interest
- −$6,716
- − Property taxes
- −$1,497
- − Insurance
- −$600
- − Repairs & maintenance
- −$1,307
- − Management
- −$1,307
- − Depreciation
- −$3,488
- Taxable income
- $1,424
- Est. tax owed @ 24.0%
- −$342
- After-tax cash flow
- $2,924/yr
For passive investors: Depreciation is non-cash, so a rental often shows a tax loss while cash-flowing — sheltering income. Rental losses are passive: they offset passive income freely, and up to $25,000/yr can offset ordinary (W-2) income if you actively participate and your MAGI is under $100k (phasing out to $0 by $150k); unused losses carry forward. On sale, claimed depreciation is recaptured at up to 25%, and gains may owe capital-gains tax (a 1031 exchange can defer both). Figures are a year-1 estimate at your 24.0% rate — not tax advice; consult a CPA.
Schools (NCES district)
- District
- Limestone Chsd 310
- NCES district ID
- 1722950
- Math proficiency
- 25% ▲ 5.00%
- Reading proficiency
- 35% ▲ 4.00%
- Median HH income
- $49,759
- Composite
- 28.99/100
- National rank
- #11932
- State rank
- #486 of 919 in IL
Livability — Bellevue
- Score
- 65/100
- State rank
- #601
- US rank
- #12423
Category grades
Schools grade is shown separately in the Schools card above.
Census & demographics
- Census place
- Bellevue, IL
- County
- Peoria County · 120,495 people
- City population
- 114,670
- Metro
- Peoria, IL
- Population (ZIP)
- 28,313
- Household income
- $52,414
- Rent vs Own
- Severe rent burden
- 815.0
Population outlook (Peoria County) Hauer SSP2
- Today (2025)
- 183,007 people
- By 2030
- 179,643 · -1.8%
- By 2040
- 171,782 · -6.1%
- By 2050
- 163,508 · -10.7%
- By 2075
- 140,178 · -23.4%
- By 2100
- 114,493 · -37.4%
Race, ethnicity, and origin ACS 2023
- Neighborhood character
- Diverse neighborhood (Simpson 0.61)
- Race & ethnicity
- White 55% Black 29% Two or more races 10% Hispanic / Latino 7% Asian 2%
- Hispanic origin (detail)
- Mexican 5%
- Common ancestry
- Italian 2% Slovak 1% Iranian 1%
- Foreign-born
- 6% · Canada, China
- Languages at home
- 92% English-only · Spanish 4% Chinese 1% French/Haitian/Cajun 1%
Political lean MEDSL · Peoria
- 2024 margin
- Toss-up / Even · D 51.5% · R 46.9% · Other 1.6%
- 2008→2024 swing
- -9.2pp toward R · 2008: 13.9pp · 2024: 4.7pp
- All cycles
- 2024: D+4.7 2020: D+6.3 2016: D+2.8 2012: D+4.4 2008: D+13.9
Not yet ingested
- Civics
- —
Market trends
- HPI YoY
- ▼ -54.15%
- Current HPI
- 165.8838
- Rent YoY
- ▲ 2.30%
- Metro
- Peoria, IL
- State GDP YoY
- ▲ 1.59%
- F500 in state
- 60
Industry mix (Fortune 500 HQ in IL)
| Industry | F500 HQs | Revenue |
|---|---|---|
| Insurance | 4 | $201B |
|
||
| Consumer Goods | 4 | $87B |
|
||
| Industrial Machinery | 3 | $64B |
|
||
| Healthcare | 2 | $55B |
|
||
| Retail / Pharmacy | 1 | $148B |
|
||
| Agriculture / Food | 1 | $86B |
|
||
Price history
+90.6% since first listed6 events — show timeline
- 2026-06-11 Coming Soon $119,900 RMLSA as Distributed by MLS Grid
- 2021-08-06 Listing Removed — RMLSA as Distributed by MLS Grid
- 2021-08-06 Listing Removed — RMLSA as Distributed by MLS Grid
- 2014-04-01 Sold (Public Records) $56,000 Public Records
- 2014-03-28 Sold (MLS) $56,000 RMLSA as Distributed by MLS Grid
- 2013-11-20 Listed $62,900 RMLSA as Distributed by MLS Grid
Property tax history
+3.2%/yrLatest (2025): $1,497 · +8.4% YoY. Source: county tax records.
Cash-flow waterfall
monthlySold comps — $/sqft
last 12 mo · ≤1 miLoading sold comps…