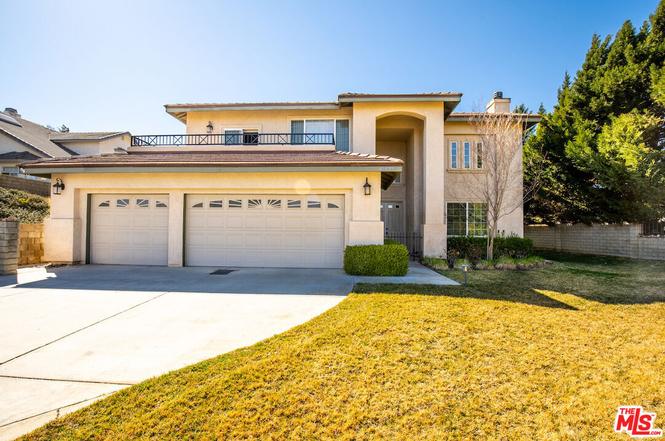
41439 Bristle Cone Dr
Palmdale, CA 93551
$550,000D+
5 bd · 6.0 ba ·
3,357 sqft ·
Built 2003
· SingleFamily
· Pending
· 14 DOM
Cashflow @ list (25.0% down · 7.5%)
Estimated rent
$5,021/mo
Mortgage (P&I)
−$2,884
Tax + insurance
−$1,136
HOA
−$0
Vac / Maint / Mgmt
−$1,054
Net cashflow
$-53/mo
Annual
$-637/yr
Cap rate
6.18%
Cash-on-cash
-0.41%
DSCR
0.98
1% rule
0.91%
Cash to close
$154,000
Investor read
- This is a 5-bed/6.0-bath single-family listed at $550k.
- At list price, monthly cash flow is $-53 ($-637/yr) — negative.
- To cash-flow at today's rent, offer at most $541k (1.7% below list).
- To meet the 1% rule (rent ≥ 1% of price), the offer needs to be $502k (8.7% below list).
- Only 14 days on market — expect competitive offers; lowballing is unlikely to land.
- Recommended offer: $502k (8.7% below list) — sets the bar for 1% rule.
- Local home prices are declining (-3.0%/yr); year-one equity from $4k of loan paydown is wiped out by about $16k of value loss. Plan a longer hold.
- Location reads 55/100 on livability (#861 in CA) — a working-class tenant base; expect higher turnover. Strengths: housing A+; Watch: crime F, amenities F, cost of living F.
- Westside Union Elementary (suburban): math 34% / reading 49% proficiency, ranked #565 of 1,400 in CA (top 40%) — families likely to look elsewhere, expect single-tenant / working-renter base with shorter leases.
- Zoned schools: Gregg Anderson Academy (math 24% / reading 24%, grade F, #973 of 1,571 statewide, top 73%, 867 students, 27% FRL); Joe Walker Middle (736 students, 60% FRL); Quartz Hill High (3,066 students, 42% FRL).
- Zoned-school proficiency averages 24% at this address vs 42% district-wide (-17 pts) — the specific schools serving this property underperform the Westside Union Elementary average; the district grade overstates school quality for this exact location.
- Market conditions: Rents rising (+2.3%/yr); 388 active listings in the ZIP; 5 comparable units currently listed for rent nearby; rentals leasing fast (median 1d on market — plan ~1-2 weeks tenant-placement turnaround); high-income renter base; 19,697 units permitted in Los Angeles County in 2024 (9,426 in 5+ unit buildings).
- Los Angeles County population projected at +9% by 2050 — modest demand growth; plan on rents tracking national, not racing it.
- 17 sale attempts since 20y ago with the ask held roughly flat each time — persistent listings suggest the price (not the market) is what's stuck; bring a comps-based counter.
- Climate carrying-cost: moderate flood risk; severe wildfire risk; extreme-heat days projected 6→14/yr by 2055 (HVAC capex compounding) — expect insurance premiums to compound above CPI over the hold.
- Cap rate 6.2% vs local median 4.5% in Palmdale — top-decile yield for the area; either an underpriced asset or a hidden risk that comps aren't pricing in. Stress-test before assuming the spread holds.
- At $5,021/mo this rent would consume 50% of the median local household income ($120k/yr) (locally 1168% of renters already pay >50% of income on rent) — very limited rent-growth headroom before tenants either downsize or default.
Questions for listing agent
- What do current leases actually rent for vs. the listed asking? Can we see a recent rent roll and the last 12 months of T-12 income?
- Is there a deadline driving the sale (1031 exchange, divorce, estate, relocation)? That informs how much negotiation room exists.
- Schools are F-rated, which usually means shorter tenancies and higher turnover. Who's the typical renter profile here, and what's been the actual vacancy rate?
- Crime grade is F in this area — have there been break-ins, vandalism, or insurance claims at this property in the last 3 years? What carrier currently insures it and at what premium?
- The area grade is low — what's the realistic commute time and amenity access for the typical tenant pool here? Any planned neighborhood developments (good or bad) we should know about?
- What's the average days-on-market for RENTAL listings here right now (not sales)? A rising rental-DOM trend means longer vacancies and softer asking-rent achievability than the comps imply.
- What's the recent tenant-quality profile in this submarket — average credit score on applications, eviction rate, late-payment / NSF rate, and stable-employment percentage? A property-management company in the area should have these aggregated.
- How much new for-sale + rental construction is in the pipeline within 1–3 miles? Heavy new supply typically softens prices + rents 12–24 months out; constrained supply supports both.
CashFlowRE · CFR-JKKC6H0JA2VQW8
· Data 4 weeks ago
cashflowre.app · 2026-05-29