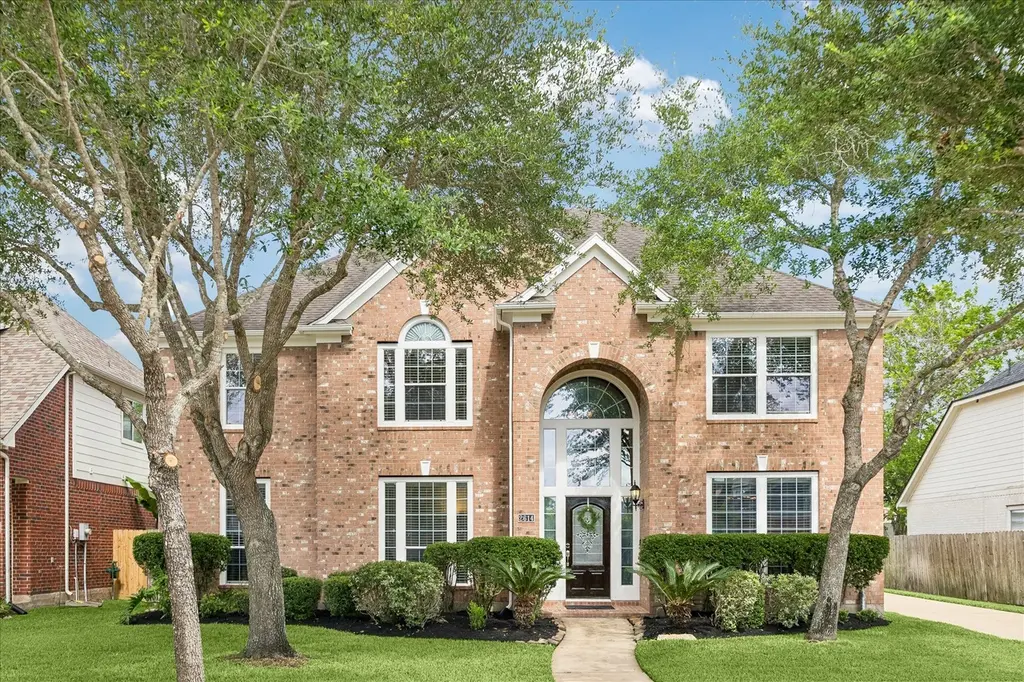
2614 Cezanne Cir
Sienna, TX 77459
$429,000B-
4 bd · 3.0 ba ·
3,128 sqft ·
Built 2006
· SingleFamily
· Active
· 17 DOM
Cashflow @ list (25.0% down · 7.5%)
Estimated rent
$5,254/mo
Mortgage (P&I)
−$2,250
Tax + insurance
−$1,058
HOA
−$132
Vac / Maint / Mgmt
−$1,103
Net cashflow
$711/mo
Annual
$8,533/yr
Cap rate
8.28%
Cash-on-cash
7.10%
DSCR
1.32
1% rule
1.22%
Cash to close
$120,120
Investor read
- This is a 4-bed/3.0-bath single-family listed at $429k.
- At list price, monthly cash flow is $711 ($9k/yr) — positive.
- The deal already cash-flows at list — no discount required.
- Meets the 1% rule at list price ($5k rent vs $429k).
- It's been on market 17 days — a 2% lower offer ($423k) is reasonable based on typical stale-listing flexibility.
- Recommended offer: $423k (1.5% below list) — sets the bar for market timing.
- Local home prices are declining (-1.7%/yr); year-one equity from $3k of loan paydown is wiped out by about $7k of value loss. Plan a longer hold.
- Location reads: area grade B — affects rentability + tenant quality, not the cash-flow math above.
- Fort Bend ISD (suburban): math 44% / reading 53% proficiency, ranked #140 of 826 in TX (top 17%) — families likely to look elsewhere, expect single-tenant / working-renter base with shorter leases.
- Zoned schools: Scanlan Oaks El (math 68% / reading 67%, grade B+, #189 of 4,322 statewide, top 5%, 1,052 students, 31% FRL); Ronald Thornton Middle (math 40% / reading 52%, grade D+, #462 of 1,662 statewide, top 28%, 1,529 students, 41% FRL); Ridge Point H S (math 61% / reading 69%, grade B, #198 of 1,632 statewide, top 12%, 3,170 students, 31% FRL) — zoned schools at 34% FRL track the district average.
- Market conditions: Rents soft (-0.1%/yr); 1229 active listings in the ZIP; 4 comparable units currently listed for rent nearby; rentals leasing fast (median 12d on market — plan ~1-2 weeks tenant-placement turnaround); high-income renter base; 12,093 units permitted in Fort Bend County in 2024 (815 in 5+ unit buildings).
- Fort Bend County population projected at +75% by 2050 — long-run rental-demand tailwind backs the buy-and-hold thesis.
- 5 sale attempts since 5y ago with the ask held roughly flat each time — persistent listings suggest the price (not the market) is what's stuck; bring a comps-based counter.
- Climate carrying-cost: severe wind risk, 99% chance of damaging wind over 30y; extreme-heat days projected 7→24/yr by 2055 (HVAC capex compounding) — expect insurance premiums to compound above CPI over the hold.
- Cap rate 8.3% vs local median 3.3% in Sienna — top-decile yield for the area; either an underpriced asset or a hidden risk that comps aren't pricing in. Stress-test before assuming the spread holds.
- At $5,254/mo this rent would consume 49% of the median local household income ($129k/yr) (locally 1004% of renters already pay >50% of income on rent) — very limited rent-growth headroom before tenants either downsize or default.
Questions for listing agent
- What does the HOA fee cover, when was the last increase, and are there any pending special assessments or reserve-fund shortfalls?
- Is there a deadline driving the sale (1031 exchange, divorce, estate, relocation)? That informs how much negotiation room exists.
- What's the average days-on-market for RENTAL listings here right now (not sales)? A rising rental-DOM trend means longer vacancies and softer asking-rent achievability than the comps imply.
- What's the recent tenant-quality profile in this submarket — average credit score on applications, eviction rate, late-payment / NSF rate, and stable-employment percentage? A property-management company in the area should have these aggregated.
- How much new for-sale + rental construction is in the pipeline within 1–3 miles? Heavy new supply typically softens prices + rents 12–24 months out; constrained supply supports both.
CashFlowRE · CFR-JPT2ND4P578P69
· Data 1 day ago
cashflowre.app · 2026-05-29