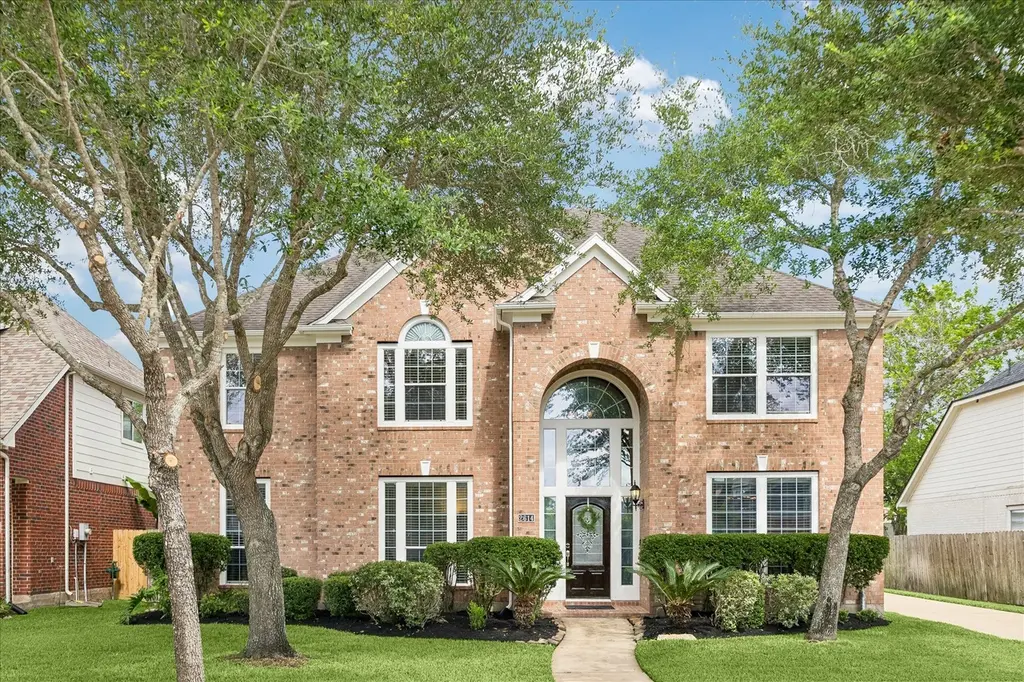
2614 Cezanne Cir · Sienna, TX
Flood risk 4/10 · Minor
- FEMA flood zone
- X
- Chance of flooding over 30 yrs
- 0.24%
- Est. flood insurance / yr
- $507 – $1,088
Fire risk 4/10 · Minor
- Est. fire insurance / yr
- $1,222 – $2,270
Heat risk 9/10 · Severe
- Hot days now (above 111°F)
- 7 days/yr
- Hot days in 30 yrs
- 24 days/yr
Wind risk 9/10 · Severe
- Chance of severe wind over 30 yrs
- 99.0%
Air-quality risk 2/10 · Minimal
- Unhealthy air days now
- 2 days/yr
- Unhealthy air days in 30 yrs
- 2 days/yr
Risk factors via First Street. Map © Google.
Why this score? — see what drove the B- grade
The composite is a weighted blend of 9 inputs, each scored 0–100. Each bar is that input's sub-score; the figure is the points it added to the 100-point composite (weight × sub-score).
- Cash flow +22.4/30.0
- ARV discount +15.0/15.0
- 1% rule +7.2/10.0
- DSCR +7.2/10.0
- Schools +4.5/10.0
- Appreciation +4.2/10.0
- Rent growth +2.5/5.0
- Livability +2.5/5.0
- Condition / age +2.5/5.0
$429,000
🖨 Deal sheet (PDF) 📄 Offer letter ✓ Due diligence
Listing remarks
Impeccably maintained Perry Home located in the heart of Sienna, featuring an open floor plan with high ceilings and abundant natural light. This spacious home offers 4 bedrooms, 3.5 baths, formal living and dining, a game room, and a private primary suite with garden tub, separate shower, double vanities, and walk-in closets. The kitchen boasts granite countertops and opens to the inviting living area with fireplace. Recent upgrades include roof replacements (2018), AC updates (down: 2021, upstair 2013, and coil replacement 2020), water heater (2021), flooring (2022 & 2026), and sprinkler system upgrade (2022). Enjoy a spacious backyard and access to Sienna’s top-tier amenities
Key facts
- Open floor plan
- Inviting living area
- Granite countertops
Tags
Property features AI
Finance
- HOA & community: Sienna Point Residential Association; Association amenities include clubhouse, controlled access, fitness center, golf course, tennis courts, and trails; Annual association fee
Exterior
- Parking: Detached 2-car garage; Additional parking
- Utilities: Public water; Public sewer
- Home design: Residential property; Built in 2006; Slab foundation; Composition roof
- Construction: Brick, stone, and wood siding construction
- Exterior features: Private yard; Fence (back yard); Subdivision setting; Concrete road surface
Interior
- Kitchen: Dishwasher; Electric oven; Disposal; Microwave
- Bedrooms: Primary bedroom on first floor (17x17); Three secondary bedrooms on second floor (15x15, 15x15, 15x15); Additional game room on second floor (18x18)
- Flooring: Plank; Tile; Vinyl
- Bathrooms: 3 full bathrooms; 1 half bathroom
- Heating & cooling: Central heating (gas); Central electric air conditioning
- Interior features: Entrance foyer; High ceilings; Kitchen island; Kitchen/family room combo; Pantry; Walk-in pantry; Gas log fireplace (1)
- Laundry & utility: Washer hookup; Electric dryer hookup
Neighborhood map
What this means for you Summary
Snapshot
- This is a 4-bed/3.0-bath single-family listed at $429k.
Deal economics
- At list price, monthly cash flow is $711 ($9k/yr) — positive.
- The deal already cash-flows at list — no discount required.
- Meets the 1% rule at list price ($5k rent vs $429k).
- Recommended offer: $423k (1.5% below list) — sets the bar for market timing.
- Cap rate 8.3% vs local median 3.3% in Sienna — top-decile yield for the area; either an underpriced asset or a hidden risk that comps aren't pricing in. Stress-test before assuming the spread holds.
Location & tenants
- Location reads: area grade B — affects rentability + tenant quality, not the cash-flow math above.
- Fort Bend ISD (suburban): math 44% / reading 53% proficiency, ranked #140 of 826 in TX (top 17%) — families likely to look elsewhere, expect single-tenant / working-renter base with shorter leases.
- Zoned schools: Scanlan Oaks El (math 68% / reading 67%, grade B+, #189 of 4,322 statewide, top 5%, 1,052 students, 31% FRL); Ronald Thornton Middle (math 40% / reading 52%, grade D+, #462 of 1,662 statewide, top 28%, 1,529 students, 41% FRL); Ridge Point H S (math 61% / reading 69%, grade B, #198 of 1,632 statewide, top 12%, 3,170 students, 31% FRL) — zoned schools at 34% FRL track the district average.
- Market conditions: Rents soft (-0.1%/yr); 1228 active listings in the ZIP; 4 comparable units currently listed for rent nearby; rentals leasing fast (median 12d on market — plan ~1-2 weeks tenant-placement turnaround); high-income renter base; 12,093 units permitted in Fort Bend County in 2024 (815 in 5+ unit buildings).
- At $5,254/mo this rent would consume 49% of the median local household income ($129k/yr) (locally 1004% of renters already pay >50% of income on rent) — very limited rent-growth headroom before tenants either downsize or default.
Forward outlook
- Local home prices are declining (-1.7%/yr); year-one equity from $3k of loan paydown is wiped out by about $7k of value loss. Plan a longer hold.
- Fort Bend County population projected at +75% by 2050 — long-run rental-demand tailwind backs the buy-and-hold thesis.
Negotiation context
- It's been on market 17 days — a 2% lower offer ($423k) is reasonable based on typical stale-listing flexibility.
- 5 sale attempts since 5y ago with the ask held roughly flat each time — persistent listings suggest the price (not the market) is what's stuck; bring a comps-based counter.
Risks & watch-outs
- Climate carrying-cost: severe wind risk, 99% chance of damaging wind over 30y; extreme-heat days projected 7→24/yr by 2055 (HVAC capex compounding) — expect insurance premiums to compound above CPI over the hold.
Questions for the listing agent
- What does the HOA fee cover, when was the last increase, and are there any pending special assessments or reserve-fund shortfalls?
- Is there a deadline driving the sale (1031 exchange, divorce, estate, relocation)? That informs how much negotiation room exists.
- What's the average days-on-market for RENTAL listings here right now (not sales)? A rising rental-DOM trend means longer vacancies and softer asking-rent achievability than the comps imply.
- What's the recent tenant-quality profile in this submarket — average credit score on applications, eviction rate, late-payment / NSF rate, and stable-employment percentage? A property-management company in the area should have these aggregated.
- How much new for-sale + rental construction is in the pipeline within 1–3 miles? Heavy new supply typically softens prices + rents 12–24 months out; constrained supply supports both.
Investment metrics
- 1% rule
- 1.22% ✓
- Cap rate
- 8.28%
- Cash-on-cash
- 7.10%
- DSCR
- 1.32
- GRM
- 6.8
CMA / ARV
- ARV (on-the-fly)
- $550,528
- Comps found
- 12
Show comp detail 12 sales within ~0.75 mi
| Address | Dist | Beds/Ba | Sqft | Sold | Price | $/sf | Match |
|---|---|---|---|---|---|---|---|
| 2230 Dali Ln | 0.06mi | 4/3.0 | 3,290 (+5%) | 6mo | $475,000 | $144 | 83 |
| 8818 Laurel Crest Dr | 0.27mi | 4/3.5 | 3,192 (+2%) | 9mo | $719,900 | $226 | 74 |
| 8815 Iron Forge Rd | 0.31mi | 4/3.5 | 3,275 (+5%) | 2mo | $535,000 | $163 | 74 |
| 8833 Snowy Owl Loop | 0.64mi | 5/3.0 (+1) | 3,126 (-0%) | 1mo | $562,900 | $180 | 64 |
| 8919 Autumn Pine Dr | 0.37mi | 4/3.5 | 3,439 (+10%) | 3mo | $597,000 | $174 | 61 |
| 9227 Turtle Pond Ln | 0.40mi | 4/4.0 | 3,404 (+9%) | 2mo | $600,000 | $176 | 61 |
| 8914 Milam Grove Dr | 0.47mi | 4/3.5 | 3,358 (+7%) | 5mo | $420,000 | $125 | 59 |
| 8930 Emerald Cane Dr | 0.59mi | 5/4.0 (+1) | 3,117 (-0%) | 10mo | $395,000 | $127 | 55 |
| 9418 San Marco Dr | 0.68mi | 4/4.5 | 3,266 (+4%) | 4mo | $745,000 | $228 | 52 |
| 8934 Stanley Oak Dr | 0.66mi | 4/3.5 | 3,280 (+5%) | 9mo | $495,000 | $151 | 52 |
| 9234 Balsam Gap | 0.60mi | 4/3.5 | 3,519 (+12%) | 7mo | $715,000 | $203 | 44 |
| 8926 Pleasant Cv | 0.74mi | 4/3.5 | 3,581 (+14%) | 5mo | $749,900 | $209 | 35 |
Match score weights: distance 35% · size 25% · config 20% · recency 20%. Top-matched comps best support the ARV.
Projected returns pro-forma
-1.67% appreciation · 0.0% rent growth · sell at horizon
- IRR
- -3.0%
- Equity multiple
- 0.88×
- Total profit
- $-14,804
- Equity at exit
- $89,974
- IRR
- 1.1%
- Equity multiple
- 1.08×
- Total profit
- $9,614
- Equity at exit
- $83,337
Cash invested: $120,120 (down + closing). Projections, not guarantees.
Landlord ↔ Tenant lean methodology
- Overall (STATE)
- 87 Strongly Landlord-Friendly
- State Texas
- 87 Strongly Landlord-Friendly · R+5
- County
- — inherits STATE
- City
- — inherits STATE
ZIP-level market 77459
- Home prices YoY
- -0.8%
- Rents YoY
- -0.1%
- Active inventory
- 1228
- Price-to-rent
- 6.8×
Monthly cashflow live
- Estimated rent
- $5,254 medium interval (Pro) →
- Mortgage (P&I)
- −$2,250
- Tax from tax record
- −$879 /mo · $10,545/yr
- Insurance
- −$179
- HOA
- −$132
- Vacancy / Maint / Mgmt
- −$1,103
- Net cashflow
- $711
Break-even live
Sensitivity live
| Price | -10% $954 | -5% $833 | +0% $711 | +5% $590 | +10% $468 |
|---|---|---|---|---|---|
| Rent | -10% $296 | -5% $504 | +0% $711 | +5% $919 | +10% $1,126 |
| Rate | -1.0pp $927 | -0.5pp $820 | base $711 | +0.5pp $600 | +1.0pp $487 |
UW: 25.0% down · 7.5% · 30yr · 1.5% tax · 5.0% vac · 8.0% maint · 8.0% mgmt
Financing live
Cash to close
- Down payment
- $107,250
- Closing costs
- $12,870
- Reserves months
- —
- Total cash needed
- —
Loan-product check · same deal, 3 products live
Conventional
25% down · 7.5% · 30yr
- Down + closing
- —
- Monthly P&I
- —
- Monthly cashflow
- —
- DSCR
- —
- Eligible?
- —
Personal DTI + credit; lowest rate.
DSCR
20% down · 8.5% · 30yr
- Down + closing
- —
- Monthly P&I
- —
- Monthly cashflow
- —
- DSCR
- —
- Eligible?
- —
No personal income docs; deal must DSCR.
Hard money
10% down · 12.0% · 12mo
- Down + closing
- —
- Monthly P&I
- —
- Monthly cashflow
- —
- DSCR
- —
- Eligible?
- —
Short-term bridge; refi at stabilization.
Rent comps 4 comps
| Address | Beds | Baths | Sqft | Rent | $/sqft | DOM | Units | Dist |
|---|---|---|---|---|---|---|---|---|
| 2718 Van Gogh Ln Missouri City, TX | 4.0 | 2.5 | 3036 | $3,595 | $1.18 | 11d | 1 | 0.15mi |
| 2142 Ironwood Pass Dr Missouri City, TX | 4.0 | 3.0 | 2140 | $6,000 | $2.80 | 0d | 1 | 0.60mi |
| 8719 Fox Trail Dr Missouri City, TX | 4.0 | 3.5 | 2143 | $6,000 | $2.80 | 23d | 1 | 0.85mi |
| 9006 Meadow Bridge Dr Missouri City, TX | 4.0 | 3.5 | 3958 | $6,580 | $1.66 | 4d | 1 | 0.97mi |
HOA detail
- Monthly dues
- $132 · $1,584/yr
- Likely covers
- water
Listing history 26 events
-
2026-06-21days on market $429,000 Active 17 DOM
-
2026-06-18days on market $429,000 Active 14 DOM
-
2026-06-17days on market $429,000 Active 13 DOM
-
2026-06-16days on market $429,000 Active 12 DOM
-
2026-06-15days on market $429,000 Active 11 DOM
-
2026-06-13days on market $429,000 Active 9 DOM
-
2026-06-09days on market $429,000 Active 5 DOM
-
2026-06-08days on market $429,000 Active 4 DOM
-
2026-06-07days on market $429,000 Active 3 DOM
-
2026-06-04pricedays on market $429,000 Active 1 DOM
-
2026-06-03days on market $439,000 Active 16 DOM
-
2026-06-02days on market $439,000 Active 15 DOM
-
2026-06-01days on market $439,000 Active 14 DOM
-
2026-05-31days on market $439,000 Active 13 DOM
-
2026-05-18$439,000 Active 827-char remark
-
2026-05-13status Pending
-
2026-05-13historical
-
2026-05-04$439,000 Active
-
2026-05-04historical
-
2026-04-18$449,000 Active
-
2021-06-30soldstatus
-
2021-06-29soldstatus Sold
-
2021-06-16status Pending, Continue to Show
-
2021-05-18price $399,999
-
2021-05-08$404,000 Active
-
2008-10-09soldstatus
ⓘ Source: listings_history table (triggers on properties + properties_extension) + one-shot
backfill from property_details.listing_events for pre-trigger history.
Tax reassessment forecast TX · Resets to sale price
- Current annual tax
- $10,545 · $879/mo
- Projected year-2 tax
- $10,545 · $879/mo
- Expected delta
- $0/yr ($0/mo · 0.0%)
ⓘ Screening estimate from a state-policy table — verify with the county assessor before closing.
Climate risk First Street
- Flood 4/10 Moderate FEMA zone X · 24% chance over 30 yrs
- Wildfire 4/10 Moderate
- Heat 9/10 Extreme 7 d/yr ≥111°F today · 24 d/yr by 30 yrs out
- Wind 9/10 Extreme 99% chance of damaging wind over 30 yrs
- Air quality 2/10 Low 2 unhealthy d/yr today · 2 by 30 yrs out
Nearby sold comps map
Loading sold comps map…
Walkable amenities ~0.75 mi
Loading nearby amenities…
Taxation est. · year 1
- Rental income
- $63,043
- − Mortgage interest
- −$24,031
- − Property taxes
- −$10,545
- − Insurance
- −$2,145
- − Repairs & maintenance
- −$5,043
- − Management
- −$5,043
- − HOA
- −$1,584
- − Depreciation
- −$12,480
- Taxable income
- $2,171
- Est. tax owed @ 24.0%
- −$521
- After-tax cash flow
- $8,012/yr
For passive investors: Depreciation is non-cash, so a rental often shows a tax loss while cash-flowing — sheltering income. Rental losses are passive: they offset passive income freely, and up to $25,000/yr can offset ordinary (W-2) income if you actively participate and your MAGI is under $100k (phasing out to $0 by $150k); unused losses carry forward. On sale, claimed depreciation is recaptured at up to 25%, and gains may owe capital-gains tax (a 1031 exchange can defer both). Figures are a year-1 estimate at your 24.0% rate — not tax advice; consult a CPA.
Schools (NCES district)
- District
- Fort Bend ISD
- NCES district ID
- 4819650
- Math proficiency
- 44% ▼ -15.00%
- Reading proficiency
- 53% ▼ -4.00%
- Median HH income
- $82,360
- Composite
- 44.61/100
- National rank
- #2779
- State rank
- #140 of 826 in TX
Livability — Sienna
No livability data for this city. (Only ~50 U.S. cities are tracked.)
Census & demographics
- Census place
- Sienna, TX
- County
- Fort Bend County · 836,777 people
- Metro
- Houston-The Woodlands-Sugar Land, TX
- Population (ZIP)
- 84,221
- Household income
- $129,151
- Rent vs Own
- Severe rent burden
- 1004.0
Population outlook (Fort Bend County) Hauer SSP2
- Today (2025)
- 1,004,526 people
- By 2030
- 1,153,104 · +14.8%
- By 2040
- 1,453,718 · +44.7%
- By 2050
- 1,753,781 · +74.6%
- By 2075
- 2,455,772 · +144.5%
- By 2100
- 2,930,528 · +191.7%
Race, ethnicity, and origin ACS 2023
- Neighborhood character
- Highly diverse neighborhood (Simpson 0.75)
- Race & ethnicity
- White 34% Black 26% Asian 22% Hispanic / Latino 13% Two or more races 10%
- Hispanic origin (detail)
- Mexican 7%
- Common ancestry
- Lithuanian 2% Slovak 1% Italian 1%
- Foreign-born
- 21% · Canada, China, Vietnam
- Languages at home
- 73% English-only · Other Asian/Pacific 8% Spanish 7% Other Indo-European 5%
Political lean MEDSL · Fort Bend
- 2024 margin
- Toss-up / Even · D 49.5% · R 47.9% · Other 2.6%
- 2008→2024 swing
- +4.0pp toward D · 2008: -2.4pp · 2024: 1.6pp
- All cycles
- 2024: D+1.6 2020: D+10.6 2016: D+6.6 2012: R+6.8 2008: R+2.4
Not yet ingested
- Civics
- —
Market trends
- HPI YoY
- ▼ -1.67%
- Current HPI
- 212.3573
- Rent YoY
- ▼ -0.15%
- Metro
- Houston-The Woodlands-Sugar Land, TX
- State GDP YoY
- ▲ 3.95%
- F500 in state
- 110
Industry mix (Fortune 500 HQ in TX)
| Industry | F500 HQs | Revenue |
|---|---|---|
| Energy | 16 | $1,198B |
|
||
| Technology | 5 | $198B |
|
||
| Engineering / Construction | 4 | $72B |
|
||
| Energy Services | 3 | $60B |
|
||
| Utilities | 3 | $41B |
|
||
| Healthcare | 2 | $330B |
|
||
Price history
+6.2% since first listed14 events — show timeline
- 2026-06-04 Listed $429,000 HARMLS
- 2026-06-04 Listing Removed — HARMLS
- 2026-05-18 Listed $439,000 HARMLS
- 2026-05-13 Pending — HARMLS
- 2026-05-13 Listing Removed — HARMLS
- 2026-05-04 Listing Removed — HARMLS
- 2026-05-04 Listed $439,000 HARMLS
- 2026-04-18 Listed $449,000 HARMLS
- 2021-06-30 Sold (Public Records) — Public Records
- 2021-06-29 Sold (MLS) — HARMLS
- 2021-06-16 Pending — HARMLS
- 2021-05-18 Price Changed $399,999 HARMLS
- 2021-05-08 Listed $404,000 HARMLS
- 2008-10-09 Sold (Public Records) — Public Records
Property tax history
+1.1%/yrLatest (2025): $10,545 · -2.4% YoY. Source: county tax records.
Cash-flow waterfall
monthlySold comps — $/sqft
last 12 mo · ≤1 miLoading sold comps…