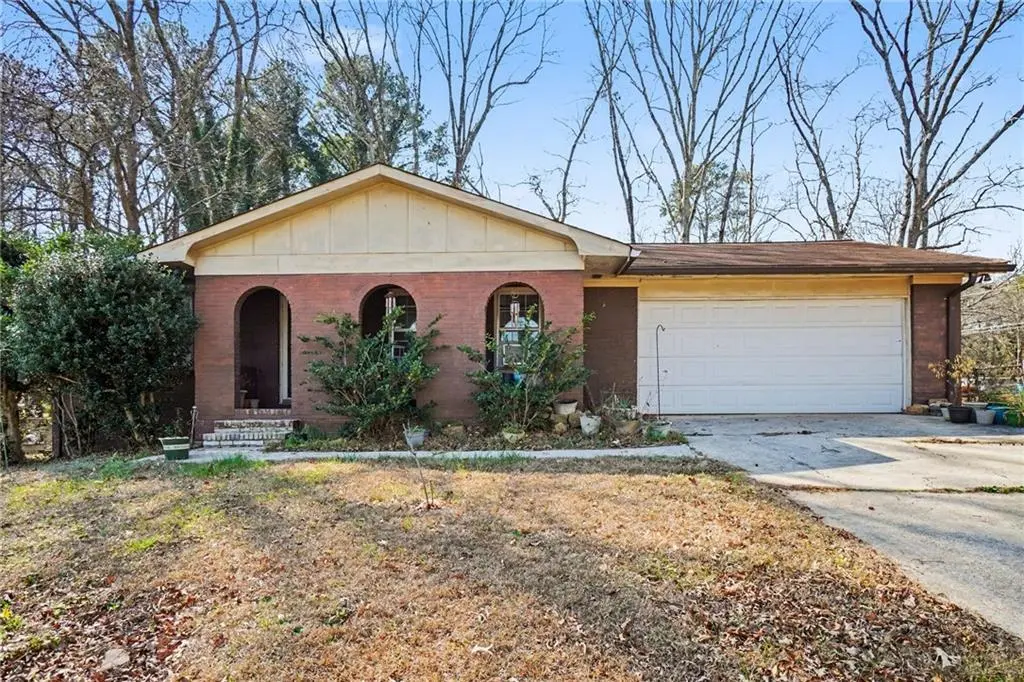
6187 Thornhedge Dr
South Fulton, GA 30296
$215,000D
3 bd · 2.0 ba ·
1,362 sqft ·
Built 1968
· SingleFamily
· Active
· 108 DOM
Cashflow @ list (25.0% down · 7.5%)
Estimated rent
$1,866/mo
Mortgage (P&I)
−$1,127
Tax + insurance
−$291
HOA
−$0
Vac / Maint / Mgmt
−$392
Net cashflow
$56/mo
Annual
$668/yr
Cap rate
6.60%
Cash-on-cash
1.11%
DSCR
1.05
1% rule
0.87%
Cash to close
$60,200
Investor read
- This is a 3-bed/2.0-bath single-family listed at $215k.
- At list price, monthly cash flow is $56 ($668/yr) — positive.
- The deal already cash-flows at list — no discount required.
- To meet the 1% rule (rent ≥ 1% of price), the offer needs to be $187k (13.2% below list).
- It's been on market 108 days — a 9% lower offer ($196k) is reasonable based on typical stale-listing flexibility.
- Recommended offer: $187k (13.2% below list) — sets the bar for 1% rule.
- Local home prices are declining (-3.0%/yr); year-one equity from $1k of loan paydown is wiped out by about $6k of value loss. Plan a longer hold.
- Location reads: area grade D — affects rentability + tenant quality, not the cash-flow math above.
- Clayton County (suburban): math 11% / reading 20% proficiency, ranked #155 of 174 in GA (top 89%) — low school quality limits family demand, transient renter base, plan for 1-2y turnover; 78% free/reduced lunch — lower-income household profile, screen leases tightly.
- Zoned schools: Oliver Elementary School (math 12% / reading 27%, grade F, #878 of 1,228 statewide, top 75%, 539 students, 90% FRL); North Clayton Middle School (math 12% / reading 27%, grade F, #356 of 470 statewide, top 78%, 767 students, 90% FRL); North Clayton High School (math 2% / reading 22%, grade F, #336 of 424 statewide, top 80%, 1,206 students, 90% FRL).
- Market conditions: Rents rising (+3.5%/yr); 142 active listings in the ZIP; 40 comparable units currently listed for rent nearby; rentals at typical pace (median 26d on market — plan ~3-4 weeks tenant-placement turnaround); 865 units permitted in Clayton County in 2024 (448 in 5+ unit buildings).
- Clayton County population projected at +29% by 2050 — long-run rental-demand tailwind backs the buy-and-hold thesis.
- 4 sale attempts since 14y ago with the ask held roughly flat each time — persistent listings suggest the price (not the market) is what's stuck; bring a comps-based counter.
- Current owner paid $170k; 27% above their basis — modest negotiation headroom, anchor on the comps not their cost.
- Climate carrying-cost: major wind risk, 27% chance of damaging wind over 30y; extreme-heat days projected 7→18/yr by 2055 (HVAC capex compounding) — expect insurance premiums to compound above CPI over the hold.
- Cap rate 6.6% vs local median 4.6% in South Fulton — top-decile yield for the area; either an underpriced asset or a hidden risk that comps aren't pricing in. Stress-test before assuming the spread holds.
- This rent runs 35% of the median local income ($63k/yr) — at the standard rent-burdened threshold; future hikes will face affordability resistance.
Questions for listing agent
- It's been on market 108 days. Have you received any prior offers? Is the seller open to a 13% concession, seller financing, or rate buy-down credit?
- Built in 1968 — when were the roof, HVAC, electrical panel, plumbing, and water heater last replaced?
- Why hasn't it sold? Are there any deal-killer items the seller is aware of (foundation, flood, title, zoning, code violations)?
- Is there a deadline driving the sale (1031 exchange, divorce, estate, relocation)? That informs how much negotiation room exists.
- The area grade is low — what's the realistic commute time and amenity access for the typical tenant pool here? Any planned neighborhood developments (good or bad) we should know about?
- What's the average days-on-market for RENTAL listings here right now (not sales)? A rising rental-DOM trend means longer vacancies and softer asking-rent achievability than the comps imply.
- What's the recent tenant-quality profile in this submarket — average credit score on applications, eviction rate, late-payment / NSF rate, and stable-employment percentage? A property-management company in the area should have these aggregated.
- How much new for-sale + rental construction is in the pipeline within 1–3 miles? Heavy new supply typically softens prices + rents 12–24 months out; constrained supply supports both.
CashFlowRE · CFR-JQJS3X5WC2E8Z0
· Data 1 day ago
cashflowre.app · 2026-05-29