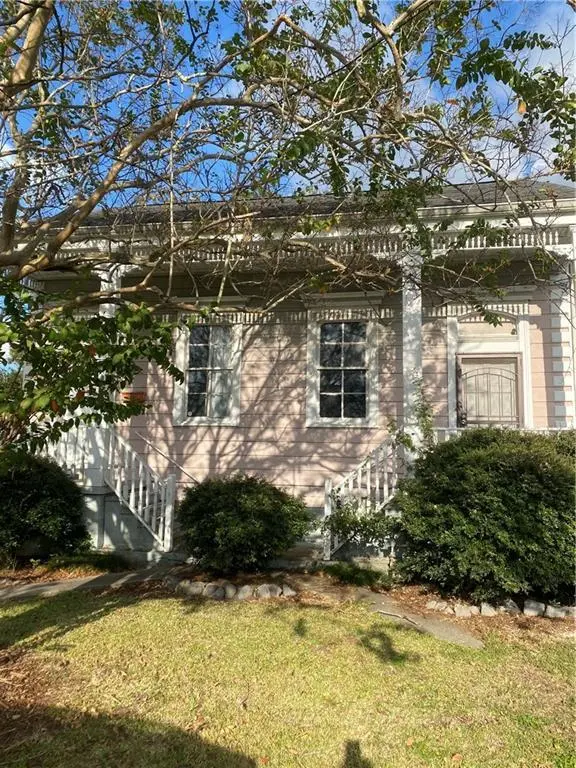
129 Ocean Ave
Gretna, LA 70053
$195,000B+
4 bd · 2.0 ba ·
2,000 sqft ·
Built 1926
· SingleFamily
· Active
· 9 DOM
Cashflow @ list (25.0% down · 7.5%)
Estimated rent
$3,060/mo
Mortgage (P&I)
−$1,023
Tax + insurance
−$189
HOA
−$0
Vac / Maint / Mgmt
−$643
Net cashflow
$1,206/mo
Annual
$14,474/yr
Cap rate
13.72%
Cash-on-cash
26.51%
DSCR
2.18
1% rule
1.57%
Cash to close
$54,600
Investor read
- This is a 4-bed/2.0-bath single-family listed at $195k.
- At list price, monthly cash flow is $1k ($14k/yr) — positive.
- The deal already cash-flows at list — no discount required.
- Meets the 1% rule at list price ($3k rent vs $195k).
- Only 9 days on market — expect competitive offers; lowballing is unlikely to land.
- Local home prices are declining (-3.0%/yr); year-one equity from $1k of loan paydown is wiped out by about $6k of value loss. Plan a longer hold.
- Location reads 70/100 on livability (#58 in LA) — a middle-class / working-renter tenant base. Strengths: cost of living A+, health & safety A+, schools B+; Watch: crime F, employment D-.
- Jefferson Parish (suburban): math 24% / reading 34% proficiency, ranked #44 of 98 in LA (top 45%) — low school quality limits family demand, transient renter base, plan for 1-2y turnover; 70% free/reduced lunch — lower-income household profile, screen leases tightly.
- Watch-outs: built in 1926 — expect roof / HVAC / electrical / plumbing capex.
- Market conditions: 113 active listings in the ZIP; 20 comparable units currently listed for rent nearby; rentals at typical pace (median 17d on market — plan ~3-4 weeks tenant-placement turnaround); lower-income renter base — watch delinquency; 518 units permitted in Jefferson Parish in 2024 (43 in 5+ unit buildings).
- 4 sale attempts since 33y ago with the ask held roughly flat each time — persistent listings suggest the price (not the market) is what's stuck; bring a comps-based counter.
- Current owner paid $50k; list at $195k implies a 290% gain — meaningful room to come down on a strong offer.
- At projected returns (-3.0% appreciation + 3.0% rent growth), your $55k cash investment doubles in ~5 years — after that, you're playing with house money.
- Cap rate 13.7% vs local median 5.1% in Gretna — top-decile yield for the area; either an underpriced asset or a hidden risk that comps aren't pricing in. Stress-test before assuming the spread holds.
- At $3,060/mo this rent would consume 92% of the median local household income ($40k/yr) (locally 1911% of renters already pay >50% of income on rent) — very limited rent-growth headroom before tenants either downsize or default.
Questions for listing agent
- Built in 1926 — when were the roof, HVAC, electrical panel, plumbing, and water heater last replaced?
- Is there a deadline driving the sale (1031 exchange, divorce, estate, relocation)? That informs how much negotiation room exists.
- Schools are B-rated — typically a magnet for longer-tenancy family renters. What's the average tenant stay here, and is there a school-zone premium baked into asking?
- Crime grade is F in this area — have there been break-ins, vandalism, or insurance claims at this property in the last 3 years? What carrier currently insures it and at what premium?
- What's the average days-on-market for RENTAL listings here right now (not sales)? A rising rental-DOM trend means longer vacancies and softer asking-rent achievability than the comps imply.
- What's the recent tenant-quality profile in this submarket — average credit score on applications, eviction rate, late-payment / NSF rate, and stable-employment percentage? A property-management company in the area should have these aggregated.
- How much new for-sale + rental construction is in the pipeline within 1–3 miles? Heavy new supply typically softens prices + rents 12–24 months out; constrained supply supports both.
CashFlowRE · CFR-JQXNDPCQC3MSAZ
· Data 2 days ago
cashflowre.app · 2026-05-29