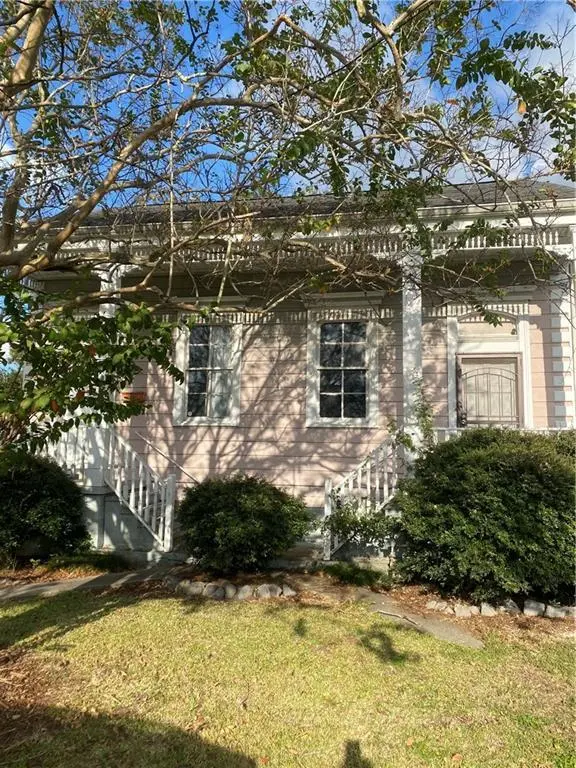
129 Ocean Ave · Gretna, LA
Flood risk No data
- FEMA flood zone
- —
- Chance of flooding over 30 yrs
- —
- Est. flood insurance / yr
- —
Fire risk No data
- Est. fire insurance / yr
- —
Heat risk No data
- Hot days now (above threshold)
- —
- Hot days in 30 yrs
- —
Wind risk No data
- Chance of severe wind over 30 yrs
- —
Air-quality risk No data
- Unhealthy air days now
- —
- Unhealthy air days in 30 yrs
- —
Risk factors via First Street. Map © Google.
Why this score? — see what drove the B+ grade
The composite is a weighted blend of 9 inputs, each scored 0–100. Each bar is that input's sub-score; the figure is the points it added to the 100-point composite (weight × sub-score).
- Cash flow +30.0/30.0
- ARV discount +15.0/15.0
- 1% rule +10.0/10.0
- DSCR +10.0/10.0
- Livability +3.5/5.0
- Rent growth +2.5/5.0
- Schools +2.5/10.0
- Condition / age +2.5/5.0
- Appreciation +0.0/10.0
$195,000
🖨 Deal sheet 📄 Offer letter ✓ Due diligence
Listing remarks MLS
Gretna neighborhood. Just steps from the river, this classic wood-frame home is filled with timeless character and original features that reflect the craftsmanship of a bygone era. Built to stand the test of time, this home is ready to be restored to its magnificent luster. Priced @ lot value, this property offers endless possibilities for renovation, restoration, or creating the home of your dreams. Bring your vision to life and make this beautiful historic treasure smile again. Rare location. Historic charm. Unlimited potential. Schedule your showing today!
Key facts
- Steps from the river
- Original features
- Historic charm
Tags
Property features AI
Finance
- Other: City lot with rectangular dimensions (48 x 148); Property listed in poor condition
Exterior
- Parking: Driveway; Off-street parking
- Utilities: Public water; Public sewer
- Home design: Single-story home; Requires total renovation; Raised foundation
- Construction: Frame construction with wood siding; Asphalt shingle roof
- Exterior features: Fenced yard; Front porch
Interior
- Bathrooms: 2 full bathrooms
- Interior features: Cathedral ceilings; High ceilings; Vaulted ceilings
Neighborhood map
What this means for you Summary
Snapshot
- This is a 4-bed/2.0-bath single-family listed at $195k.
Deal economics
- At list price, monthly cash flow is $1k ($14k/yr) — positive.
- The deal already cash-flows at list — no discount required.
- Meets the 1% rule at list price ($3k rent vs $195k).
- Cap rate 13.7% vs local median 5.1% in Gretna — top-decile yield for the area; either an underpriced asset or a hidden risk that comps aren't pricing in. Stress-test before assuming the spread holds.
Location & tenants
- Location reads 70/100 on livability (#58 in LA) — a middle-class / working-renter tenant base. Strengths: cost of living A+, health & safety A+, schools B+; Watch: crime F, employment D-.
- Jefferson Parish (suburban): math 24% / reading 34% proficiency, ranked #44 of 98 in LA (top 45%) — low school quality limits family demand, transient renter base, plan for 1-2y turnover; 70% free/reduced lunch — lower-income household profile, screen leases tightly.
- Market conditions: 113 active listings in the ZIP; 20 comparable units currently listed for rent nearby; rentals at typical pace (median 17d on market — plan ~3-4 weeks tenant-placement turnaround); lower-income renter base — watch delinquency; 518 units permitted in Jefferson Parish in 2024 (43 in 5+ unit buildings).
- At $3,060/mo this rent would consume 92% of the median local household income ($40k/yr) (locally 1911% of renters already pay >50% of income on rent) — very limited rent-growth headroom before tenants either downsize or default.
Forward outlook
- Local home prices are declining (-3.0%/yr); year-one equity from $1k of loan paydown is wiped out by about $6k of value loss. Plan a longer hold.
- At projected returns (-3.0% appreciation + 3.0% rent growth), your $55k cash investment doubles in ~5 years — after that, you're playing with house money.
Negotiation context
- Only 9 days on market — expect competitive offers; lowballing is unlikely to land.
- 4 sale attempts since 33y ago with the ask held roughly flat each time — persistent listings suggest the price (not the market) is what's stuck; bring a comps-based counter.
- Current owner paid $50k; list at $195k implies a 290% gain — meaningful room to come down on a strong offer.
Risks & watch-outs
- Watch-outs: built in 1926 — expect roof / HVAC / electrical / plumbing capex.
Questions for the listing agent
- Built in 1926 — when were the roof, HVAC, electrical panel, plumbing, and water heater last replaced?
- Is there a deadline driving the sale (1031 exchange, divorce, estate, relocation)? That informs how much negotiation room exists.
- Schools are B-rated — typically a magnet for longer-tenancy family renters. What's the average tenant stay here, and is there a school-zone premium baked into asking?
- Crime grade is F in this area — have there been break-ins, vandalism, or insurance claims at this property in the last 3 years? What carrier currently insures it and at what premium?
- What's the average days-on-market for RENTAL listings here right now (not sales)? A rising rental-DOM trend means longer vacancies and softer asking-rent achievability than the comps imply.
- What's the recent tenant-quality profile in this submarket — average credit score on applications, eviction rate, late-payment / NSF rate, and stable-employment percentage? A property-management company in the area should have these aggregated.
- How much new for-sale + rental construction is in the pipeline within 1–3 miles? Heavy new supply typically softens prices + rents 12–24 months out; constrained supply supports both.
Investment metrics
- 1% rule
- 1.57% ✓
- Cap rate
- 13.72%
- Cash-on-cash
- 26.51%
- DSCR
- 2.18
- GRM
- 5.3
CMA / ARV
- ARV (on-the-fly)
- $364,000
- Comps found
- 6
Show comp detail 6 sales within ~0.75 mi
| Address | Dist | Beds/Ba | Sqft | Sold | Price | $/sf | Match |
|---|---|---|---|---|---|---|---|
| 1401 Jefferson St | 0.23mi | 3/2.0 (-1) | 1,700 (-15%) | 9mo | $309,500 | $182 | 51 |
| 718 Monroe St | 0.52mi | 3/2.0 (-1) | 2,224 (+11%) | 9mo | $379,900 | $171 | 45 |
| 918 Perry St | 0.64mi | 3/2.0 (-1) | 1,736 (-13%) | 0mo | $80,000 | $46 | 43 |
| 800 Hancock St | 0.64mi | 3/1.0 (-1) | 1,873 (-6%) | 15mo | $190,000 | $101 | 38 |
| 620 Amelia St | 0.74mi | 3/2.0 (-1) | 2,128 (+6%) | 17mo | $468,500 | $220 | 35 |
| 40 Holly Dr | 0.63mi | 3/3.0 (-1) | 1,712 (-14%) | 9mo | $385,000 | $225 | 30 |
Match score weights: distance 35% · size 25% · config 20% · recency 20%. Top-matched comps best support the ARV.
Projected returns pro-forma
-3.0% appreciation · 3.0% rent growth · sell at horizon
- IRR
- 20.3%
- Equity multiple
- 1.83×
- Total profit
- $45,183
- Equity at exit
- $29,075
- IRR
- 28.5%
- Equity multiple
- 3.53×
- Total profit
- $138,108
- Equity at exit
- $16,860
Cash invested: $54,600 (down + closing). Projections, not guarantees.
Landlord ↔ Tenant lean methodology
- Overall (STATE)
- 90 Strongly Landlord-Friendly
- State Louisiana
- 90 Strongly Landlord-Friendly · R+12
- County
- — inherits STATE
- City
- — inherits STATE
ZIP-level market 70053
- Active inventory
- 113
- Price-to-rent
- 5.3×
Monthly cashflow live
- Estimated rent
- $3,060 high interval (Pro) →
- Mortgage (P&I)
- −$1,023
- Tax from tax record
- −$107 /mo · $1,288/yr
- Insurance
- −$81
- HOA
- −$0
- Vacancy / Maint / Mgmt
- −$643
- Net cashflow
- $1,206
Break-even live
UW: 25.0% down · 7.5% · 30yr · 1.5% tax · 5.0% vac · 8.0% maint · 8.0% mgmt
Financing live
Cash to close
- Down payment
- $48,750
- Closing costs
- $5,850
- Reserves months
- —
- Total cash needed
- —
Loan-product check · same deal, 3 products live
Conventional
25% down · 7.5% · 30yr
- Down + closing
- —
- Monthly P&I
- —
- Monthly cashflow
- —
- DSCR
- —
- Eligible?
- —
Personal DTI + credit; lowest rate.
DSCR
20% down · 8.5% · 30yr
- Down + closing
- —
- Monthly P&I
- —
- Monthly cashflow
- —
- DSCR
- —
- Eligible?
- —
No personal income docs; deal must DSCR.
Hard money
10% down · 12.0% · 12mo
- Down + closing
- —
- Monthly P&I
- —
- Monthly cashflow
- —
- DSCR
- —
- Eligible?
- —
Short-term bridge; refi at stabilization.
Rent comps 20 comps
| Address | Beds | Baths | Sqft | Rent | $/sqft | DOM | Units | Dist |
|---|---|---|---|---|---|---|---|---|
| 2041 S Chippewa St Unit 2041 New Orleans, LA | 3.0 | 2.5 | 1400 | $2,700 | $1.93 | 43d | 1 | 0.91mi |
| 1420 Annunciation St New Orleans, LA | 1.0–3.0 | 1.0–2.0 | 1019 | $2,390 | $2.35 | 1d | 78 | 0.98mi |
| 921 Race St Unit C New Orleans, LA | 3.0 | 2.0 | 1570 | $3,000 | $1.91 | 10d | 1 | 0.99mi |
| 513 Park Blvd New Orleans, LA | 3.0 | 2.0 | 1600 | $2,300 | $1.44 | 3d | 1 | 1.02mi |
| 2028 Magazine St New Orleans, LA | 3.0 | 2.5 | 2600 | $7,000 | $2.69 | 17d | 1 | 1.13mi |
| 1204 Saint Andrew St Unit 1204 New Orleans, LA | 3.0 | 2.0 | 1600 | $2,300 | $1.44 | 23d | 1 | 1.19mi |
| 1050 Annunciation St Unit 1272355P New Orleans, LA | 2.0–5.0 | 2.0–4.0 | 1544 | $3,489 | $2.26 | 3d | 3 | 1.20mi |
| 1306 Felicity St Unit C New Orleans, LA | 3.0 | 3.0 | 1500 | $2,450 | $1.63 | 17d | 1 | 1.20mi |
| 127 Willow Dr Gretna, LA | 3.0 | 2.0 | 2250 | $2,300 | $1.02 | 23d | 1 | 1.20mi |
| 127 Willow Dr Gretna, LA | 3.0 | 2.0 | 2250 | $2,200 | $0.98 | 43d | 1 | 1.20mi |
| 530 2nd St New Orleans, LA | 3.0 | 2.5 | 2050 | $5,250 | $2.56 | 43d | 1 | 1.21mi |
| 515 3rd St New Orleans, LA | 3.0 | 3.0 | 1687 | $2,650 | $1.57 | 44d | 1 | 1.23mi |
| 2517 Saint Thomas St New Orleans, LA | 3.0 | 3.0 | 2010 | $4,000 | $1.99 | 3d | 1 | 1.24mi |
| 1435 Euterpe St New Orleans, LA | 4.0 | 3.5 | 2825 | $16,000 | $5.66 | 16d | 1 | 1.29mi |
| 1021 1st St New Orleans, LA | 4.0 | 4.0 | 2621 | $4,500 | $1.72 | 3d | 1 | 1.31mi |
| 1525 Melpomene St Unit Na New Orleans, LA | 3.0 | 1.5 | 1700 | $4,000 | $2.35 | 43d | 1 | 1.38mi |
| 2320 Mardi Gras Blvd New Orleans, LA | 4.0 | 2.5 | 1600 | $2,500 | $1.56 | 1d | 1 | 1.39mi |
| 433 Homer St Unit 1 New Orleans, LA | 4.0 | 2.0 | 1570 | $1,850 | $1.18 | 23d | 1 | 1.44mi |
| 2608 Magazine St New Orleans, LA | 3.0 | 2.0 | 1844 | $3,100 | $1.68 | 43d | 1 | 1.44mi |
| 2628 Magazine St New Orleans, LA | 3.0 | 2.0 | 1400 | $2,650 | $1.89 | 17d | 1 | 1.47mi |
Listing history 7 events
-
2026-06-18days on market $195,000 Active 9 DOM
-
2026-06-17days on market $195,000 Active 8 DOM
-
2026-06-16days on market $195,000 Active 7 DOM
-
2026-06-15days on market $195,000 Active 6 DOM
-
2026-06-13days on market $195,000 Active 4 DOM
-
2026-06-10remarks 565-char remark
-
2026-06-10$195,000 Active 1 DOM
ⓘ Source: listings_history table (triggers on properties + properties_extension) + one-shot
backfill from property_details.listing_events for pre-trigger history.
Tax reassessment forecast LA · Resets to sale price
- Current annual tax
- $1,288 · $107/mo
- Projected year-2 tax
- $1,288 · $107/mo
- Expected delta
- $0/yr ($0/mo · 0.0%)
ⓘ Screening estimate from a state-policy table — verify with the county assessor before closing.
Nearby sold comps map
Loading sold comps map…
Walkable amenities ~0.75 mi
Loading nearby amenities…
Taxation est. · year 1
- Rental income
- $36,718
- − Mortgage interest
- −$10,923
- − Property taxes
- −$1,288
- − Insurance
- −$975
- − Repairs & maintenance
- −$2,937
- − Management
- −$2,937
- − Depreciation
- −$5,673
- Taxable income
- $11,985
- Est. tax owed @ 24.0%
- −$2,876
- After-tax cash flow
- $11,597/yr
For passive investors: Depreciation is non-cash, so a rental often shows a tax loss while cash-flowing — sheltering income. Rental losses are passive: they offset passive income freely, and up to $25,000/yr can offset ordinary (W-2) income if you actively participate and your MAGI is under $100k (phasing out to $0 by $150k); unused losses carry forward. On sale, claimed depreciation is recaptured at up to 25%, and gains may owe capital-gains tax (a 1031 exchange can defer both). Figures are a year-1 estimate at your 24.0% rate — not tax advice; consult a CPA.
Schools (NCES district)
- District
- Jefferson Parish
- NCES district ID
- 2200840
- Math proficiency
- 24% ▼ -36.00%
- Reading proficiency
- 34% ▼ -30.00%
- Median HH income
- $48,421
- Composite
- 25.19/100
- National rank
- #7511
- State rank
- #44 of 98 in LA
Livability — Gretna
- Score
- 70/100
- State rank
- #58
- US rank
- #7679
Category grades
Schools grade is shown separately in the Schools card above.
Census & demographics
- Census place
- Gretna, LA
- County
- Jefferson Parish · 426,999 people
- City population
- 56,969
- Metro
- New Orleans-Metairie, LA
- Population (ZIP)
- 16,621
- Household income
- $39,950
- Rent vs Own
- Severe rent burden
- 1911.0
Population outlook (Jefferson County) Hauer SSP2
- Today (2025)
- 451,696 people
- By 2030
- 455,451 · +0.8%
- By 2040
- 458,308 · +1.5%
- By 2050
- 461,031 · +2.1%
- By 2075
- 476,351 · +5.5%
- By 2100
- 499,377 · +10.6%
Race, ethnicity, and origin ACS 2023
- Neighborhood character
- Diverse neighborhood (Simpson 0.70)
- Race & ethnicity
- White 36% Black 34% Hispanic / Latino 23% Two or more races 15% Asian 2%
- Hispanic origin (detail)
- Mexican 4% Cuban 2%
- Common ancestry
- Lithuanian 7% Iranian 1% Slovak 1%
- Foreign-born
- 19% · Canada, Vietnam, China
- Languages at home
- 76% English-only · Spanish 20% Vietnamese 1% German/W. Germanic 1%
Political lean MEDSL · Jefferson
- 2024 margin
- R (+12.9) · D 42.5% · R 55.5% · Other 2.1%
- 2008→2024 swing
- +13.6pp toward D · 2008: -26.6pp · 2024: -12.9pp
- All cycles
- 2024: R+12.9 2020: R+11.1 2016: R+14.8 2012: R+18.4 2008: R+26.6
Not yet ingested
- Civics
- —
Market trends
- HPI YoY
- ▼ -115.90%
- Current HPI
- 121.765
- Rent YoY
- —
- Metro
- New Orleans-Metairie, LA
- State GDP YoY
- ▲ 3.29%
- F500 in state
- 10
Industry mix (Fortune 500 HQ in LA)
| Industry | F500 HQs | Revenue |
|---|---|---|
| Telecommunications | 2 | $23B |
|
||
| Utilities | 1 | $12B |
|
||
| Wholesale / Distribution | 1 | $5B |
|
||
| Advertising | 1 | $2B |
|
||
Price history
+875.0% since first listed7 events — show timeline
- 2026-06-08 Listed $195,000 AcadianaMLS
- 2026-06-08 Listed $195,000 GSREIN
- 2025-05-20 Sold (Public Records) $50,000 Public Records
- 2000-06-01 Sold (Public Records) $45,000 Public Records
- 1993-12-01 Sold (MLS) $11,000 GSREIN
- 1993-01-25 Listed $20,000 AcadianaMLS
- 1993-01-25 Listed $20,000 GSREIN
Property tax history
+1.4%/yrLatest (2025): $1,288 · -0.2% YoY. Source: county tax records.
Cash-flow waterfall
monthlySold comps — $/sqft
last 12 mo · ≤1 miLoading sold comps…