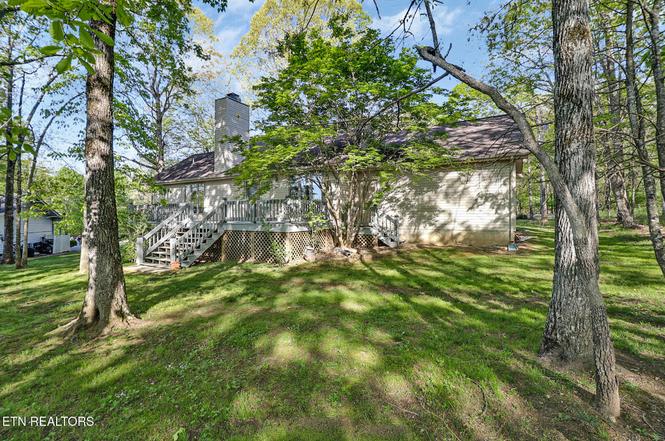
139 Fairhaven Dr
Fairfield Glade, TN 38558
$264,900D
3 bd · 2.0 ba ·
1,288 sqft ·
Built 1996
· SingleFamily
· Active
· 104 DOM
Cashflow @ list (25.0% down · 7.5%)
Estimated rent
$2,037/mo
Mortgage (P&I)
−$1,389
Tax + insurance
−$159
HOA
−$125
Vac / Maint / Mgmt
−$428
Net cashflow
$-63/mo
Annual
$-760/yr
Cap rate
6.01%
Cash-on-cash
-1.02%
DSCR
0.95
1% rule
0.77%
Cash to close
$74,172
Investor read
- This is a 3-bed/2.0-bath single-family listed at $265k.
- At list price, monthly cash flow is $-63 ($-760/yr) — negative.
- To cash-flow at today's rent, offer at most $254k (4.2% below list).
- To meet the 1% rule (rent ≥ 1% of price), the offer needs to be $204k (23.1% below list).
- It's been on market 104 days — a 9% lower offer ($241k) is reasonable based on typical stale-listing flexibility.
- Recommended offer: $204k (23.1% below list) — sets the bar for 1% rule.
- Local home prices are declining (-2.1%/yr); year-one equity from $2k of loan paydown is wiped out by about $5k of value loss. Plan a longer hold.
- Location reads 61/100 on livability (#249 in TN) — a middle-class / working-renter tenant base. Strengths: cost of living A+, housing A+, employment B; Watch: amenities F, commute F, health & safety F.
- Cumberland County (rural): math 30% / reading 31% proficiency, ranked #59 of 139 in TN (top 42%) — families likely to look elsewhere, expect single-tenant / working-renter base with shorter leases.
- Zoned schools: Stone Elementary (math 29% / reading 29%, grade F, #461 of 952 statewide, top 49%, 624 students, 0% FRL); Stone Memorial High School (math 19% / reading 45%, grade F, #56 of 332 statewide, top 20%, 1,031 students, 0% FRL) — zoned schools average 0% FRL vs 56% district-wide (56 pts lower); this property's tenant base skews higher-income than the district average.
- Market conditions: 596 active listings in the ZIP; 114 units permitted in Cumberland County in 2024 (0 in 5+ unit buildings).
- Cumberland County population projected at +7% by 2050 — modest demand growth; plan on rents tracking national, not racing it.
- 6 sale attempts since 25y ago with the ask held roughly flat each time — persistent listings suggest the price (not the market) is what's stuck; bring a comps-based counter.
- Current owner paid $128k; list at $265k implies a 107% gain — meaningful room to come down on a strong offer.
- Cap rate 6.0% vs local median 2.2% in Fairfield Glade — top-decile yield for the area; either an underpriced asset or a hidden risk that comps aren't pricing in. Stress-test before assuming the spread holds.
Questions for listing agent
- What do current leases actually rent for vs. the listed asking? Can we see a recent rent roll and the last 12 months of T-12 income?
- It's been on market 104 days. Have you received any prior offers? Is the seller open to a 23% concession, seller financing, or rate buy-down credit?
- What does the HOA fee cover, when was the last increase, and are there any pending special assessments or reserve-fund shortfalls?
- Why hasn't it sold? Are there any deal-killer items the seller is aware of (foundation, flood, title, zoning, code violations)?
- Is there a deadline driving the sale (1031 exchange, divorce, estate, relocation)? That informs how much negotiation room exists.
- Schools are D-rated, which usually means shorter tenancies and higher turnover. Who's the typical renter profile here, and what's been the actual vacancy rate?
- The area grade is low — what's the realistic commute time and amenity access for the typical tenant pool here? Any planned neighborhood developments (good or bad) we should know about?
- What's the average days-on-market for RENTAL listings here right now (not sales)? A rising rental-DOM trend means longer vacancies and softer asking-rent achievability than the comps imply.
CashFlowRE · CFR-JR5E8FEJ5MN5FX
· Data 2 days ago
cashflowre.app · 2026-05-29