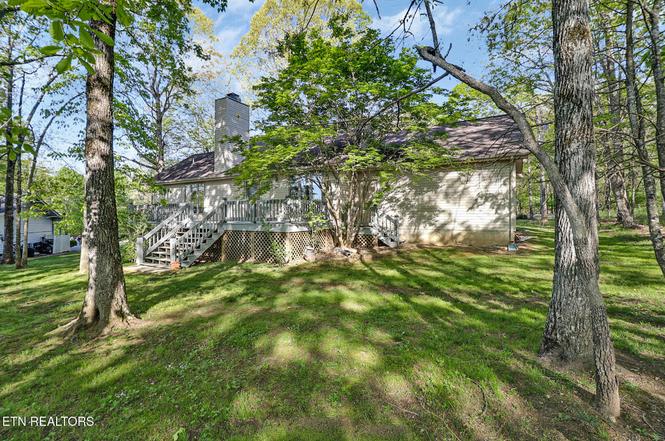
139 Fairhaven Dr · Fairfield Glade, TN
Flood risk 1/10 · Minimal
- FEMA flood zone
- X (unshaded)
- Chance of flooding over 30 yrs
- 0.0%
- Est. flood insurance / yr
- $507 – $1,088
Fire risk 2/10 · Minimal
- Est. fire insurance / yr
- $949 – $1,763
Heat risk 3/10 · Minor
- Hot days now (above 98°F)
- 7 days/yr
- Hot days in 30 yrs
- 20 days/yr
Wind risk 3/10 · Minor
- Chance of severe wind over 30 yrs
- 7.0%
Air-quality risk 2/10 · Minimal
- Unhealthy air days now
- 1 days/yr
- Unhealthy air days in 30 yrs
- 2 days/yr
Risk factors via First Street. Map © Google.
Why this score? — see what drove the D grade
The composite is a weighted blend of 9 inputs, each scored 0–100. Each bar is that input's sub-score; the figure is the points it added to the 100-point composite (weight × sub-score).
- Cash flow +12.0/30.0
- ARV discount +7.5/15.0
- Appreciation +4.0/10.0
- DSCR +3.5/10.0
- Livability +3.1/5.0
- 1% rule +2.7/10.0
- Schools +2.6/10.0
- Rent growth +2.5/5.0
- Condition / age +2.5/5.0
$264,900
🖨 Deal sheet 📄 Offer letter ✓ Due diligence
Listing remarks
CHARMING COTTAGE IN THE HEART OF FAIRFIELD GLADE! EXCELLENT CONDITION FOR PRCE! EASY ACCESS TO ALL AMENITIES, Decking has all been redone and is extra large for your outdoor space! which is so important in Fairfield! JUST THE RIGHT SIZE FOR TRANQUIL EASY LIVING WITH OPEN FLOOR PLAN, LARGE DECK AND WALK IN CLOSET IN PRIMARY BEDROOM WHICH ALSO BOAST A TREY CEILING. COME MAKE IT YOUR OWN!
Key facts
- Large deck
- Easy access
- Open floor plan
Tags
Property features AI
Finance
- HOA & community: Monthly association fee ($125); Association amenities: golf course, recreation facilities, security; Association fee includes: fire protection, trash, sewer, security and some amenities
Exterior
- Parking: Attached 2-car garage; Main level parking
- Security: Community security
- Utilities: Public sewer
- Home design: Detached property; 1,288 building area (tax records)
- Construction: Vinyl siding; Brick; Frame construction; Crawl space foundation; Brick wood-burning fireplace (1)
- Exterior features: Wooded lot; Located in a golf community; Sidewalks; 100 x 140 lot dimensions
Interior
- Kitchen: Dishwasher; Microwave; Refrigerator
- Bedrooms: 5 total rooms
- Flooring: Carpet; Vinyl
- Bathrooms: 2 full bathrooms
- Heating & cooling: Heat pump; Electric heating; Central cooling; Heating and cooling present
- Interior features: Walk-in closet(s); Eat-in kitchen; Drapes
- Laundry & utility: Washer; Dryer
Neighborhood map
What this means for you Summary
Snapshot
- This is a 3-bed/2.0-bath single-family listed at $265k.
Deal economics
- At list price, monthly cash flow is $-63 ($-760/yr) — negative.
- To cash-flow at today's rent, offer at most $254k (4.2% below list).
- To meet the 1% rule (rent ≥ 1% of price), the offer needs to be $204k (23.1% below list).
- Recommended offer: $204k (23.1% below list) — sets the bar for 1% rule.
- Cap rate 6.0% vs local median 2.2% in Fairfield Glade — top-decile yield for the area; either an underpriced asset or a hidden risk that comps aren't pricing in. Stress-test before assuming the spread holds.
Location & tenants
- Location reads 61/100 on livability (#249 in TN) — a middle-class / working-renter tenant base. Strengths: cost of living A+, housing A+, employment B; Watch: amenities F, commute F, health & safety F.
- Cumberland County (rural): math 30% / reading 31% proficiency, ranked #59 of 139 in TN (top 42%) — families likely to look elsewhere, expect single-tenant / working-renter base with shorter leases.
- Zoned schools: Stone Elementary (math 29% / reading 29%, grade F, #461 of 952 statewide, top 49%, 624 students, 0% FRL); Stone Memorial High School (math 19% / reading 45%, grade F, #56 of 332 statewide, top 20%, 1,031 students, 0% FRL) — zoned schools average 0% FRL vs 56% district-wide (56 pts lower); this property's tenant base skews higher-income than the district average.
- Market conditions: 596 active listings in the ZIP; 114 units permitted in Cumberland County in 2024 (0 in 5+ unit buildings).
Forward outlook
- Local home prices are declining (-2.1%/yr); year-one equity from $2k of loan paydown is wiped out by about $5k of value loss. Plan a longer hold.
- Cumberland County population projected at +7% by 2050 — modest demand growth; plan on rents tracking national, not racing it.
Negotiation context
- It's been on market 104 days — a 9% lower offer ($241k) is reasonable based on typical stale-listing flexibility.
- 6 sale attempts since 25y ago with the ask held roughly flat each time — persistent listings suggest the price (not the market) is what's stuck; bring a comps-based counter.
- Current owner paid $128k; list at $265k implies a 107% gain — meaningful room to come down on a strong offer.
Questions for the listing agent
- What do current leases actually rent for vs. the listed asking? Can we see a recent rent roll and the last 12 months of T-12 income?
- It's been on market 104 days. Have you received any prior offers? Is the seller open to a 23% concession, seller financing, or rate buy-down credit?
- What does the HOA fee cover, when was the last increase, and are there any pending special assessments or reserve-fund shortfalls?
- Why hasn't it sold? Are there any deal-killer items the seller is aware of (foundation, flood, title, zoning, code violations)?
- Is there a deadline driving the sale (1031 exchange, divorce, estate, relocation)? That informs how much negotiation room exists.
- Schools are D-rated, which usually means shorter tenancies and higher turnover. Who's the typical renter profile here, and what's been the actual vacancy rate?
- The area grade is low — what's the realistic commute time and amenity access for the typical tenant pool here? Any planned neighborhood developments (good or bad) we should know about?
- What's the average days-on-market for RENTAL listings here right now (not sales)? A rising rental-DOM trend means longer vacancies and softer asking-rent achievability than the comps imply.
- What's the recent tenant-quality profile in this submarket — average credit score on applications, eviction rate, late-payment / NSF rate, and stable-employment percentage? A property-management company in the area should have these aggregated.
- How much new for-sale + rental construction is in the pipeline within 1–3 miles? Heavy new supply typically softens prices + rents 12–24 months out; constrained supply supports both.
Investment metrics
- 1% rule
- 0.77% ✗
- Cap rate
- 6.01%
- Cash-on-cash
- -1.02%
- DSCR
- 0.95
- GRM
- 10.8
CMA / ARV
No comps found within radius.
Projected returns pro-forma
-2.06% appreciation · 3.0% rent growth · sell at horizon
- IRR
- -12.5%
- Equity multiple
- 0.51×
- Total profit
- $-36,426
- Equity at exit
- $50,773
- IRR
- -4.9%
- Equity multiple
- 0.63×
- Total profit
- $-27,757
- Equity at exit
- $42,749
Cash invested: $74,172 (down + closing). Projections, not guarantees.
Landlord ↔ Tenant lean methodology
- Overall (STATE)
- 87 Strongly Landlord-Friendly
- State Tennessee
- 87 Strongly Landlord-Friendly · R+13
- County
- — inherits STATE
- City
- — inherits STATE
ZIP-level market 38558
- Home prices YoY
- -0.8%
- Active inventory
- 596
- Price-to-rent
- 10.8×
Monthly cashflow live
- Estimated rent
- $2,037 medium interval (Pro) →
- Mortgage (P&I)
- −$1,389
- Tax from tax record
- −$48 /mo · $581/yr
- Insurance
- −$110
- HOA
- −$125
- Vacancy / Maint / Mgmt
- −$428
- Net cashflow
- $-63
Break-even live
UW: 25.0% down · 7.5% · 30yr · 1.5% tax · 5.0% vac · 8.0% maint · 8.0% mgmt
Financing live
Cash to close
- Down payment
- $66,225
- Closing costs
- $7,947
- Reserves months
- —
- Total cash needed
- —
Loan-product check · same deal, 3 products live
Conventional
25% down · 7.5% · 30yr
- Down + closing
- —
- Monthly P&I
- —
- Monthly cashflow
- —
- DSCR
- —
- Eligible?
- —
Personal DTI + credit; lowest rate.
DSCR
20% down · 8.5% · 30yr
- Down + closing
- —
- Monthly P&I
- —
- Monthly cashflow
- —
- DSCR
- —
- Eligible?
- —
No personal income docs; deal must DSCR.
Hard money
10% down · 12.0% · 12mo
- Down + closing
- —
- Monthly P&I
- —
- Monthly cashflow
- —
- DSCR
- —
- Eligible?
- —
Short-term bridge; refi at stabilization.
HOA detail
- Monthly dues
- $125 · $1,500/yr
Listing history 29 events
-
2026-06-18days on market $264,900 Active 104 DOM
-
2026-06-17days on market $264,900 Active 103 DOM
-
2026-06-16days on market $264,900 Active 102 DOM
-
2026-06-15days on market $264,900 Active 101 DOM
-
2026-06-13days on market $264,900 Active 99 DOM
-
2026-06-12days on market $264,900 Active 98 DOM
-
2026-06-09days on market $264,900 Active 95 DOM
-
2026-06-08days on market $264,900 Active 94 DOM
-
2026-06-08days on market $264,900 Active 93 DOM
-
2026-06-07days on market $264,900 Active 92 DOM
-
2026-06-03days on market $264,900 Active 89 DOM
-
2026-06-02days on market $264,900 Active 88 DOM
-
2026-06-01days on market $264,900 Active 87 DOM
-
2026-05-31days on market $264,900 Active 86 DOM
-
2026-03-06$264,900 Active
-
2025-11-01historical
-
2025-08-28price $274,900
-
2025-04-03$279,500 Active
-
2009-04-06$149,000
-
2005-03-14soldstatus $128,000
-
2005-03-11soldstatus $128,000
-
2005-02-07$130,000
-
2004-11-18soldstatus $127,000
-
2004-11-15soldstatus $127,000
-
2004-05-10$128,900
-
2002-12-24soldstatus $114,000
-
2001-11-01$119,000
-
1998-06-30soldstatus $113,000
-
1996-10-09soldstatus $105,700
ⓘ Source: listings_history table (triggers on properties + properties_extension) + one-shot
backfill from property_details.listing_events for pre-trigger history.
Tax reassessment forecast TN · Resets to sale price
- Current annual tax
- $581 · $48/mo
- Projected year-2 tax
- $1,881 · $157/mo
- Expected delta
- +$1,300/yr (+$108/mo · 223.7%)
ⓘ Screening estimate from a state-policy table — verify with the county assessor before closing.
Climate risk First Street
- Flood 1/10 Low FEMA zone X (unshaded) · 0% chance over 30 yrs
- Wildfire 2/10 Low
- Heat 3/10 Moderate 7 d/yr ≥98°F today · 20 d/yr by 30 yrs out
- Wind 3/10 Moderate 7% chance of damaging wind over 30 yrs
- Air quality 2/10 Low 1 unhealthy d/yr today · 2 by 30 yrs out
Nearby sold comps map
Loading sold comps map…
Walkable amenities ~0.75 mi
Loading nearby amenities…
Taxation est. · year 1
- Rental income
- $24,450
- − Mortgage interest
- −$14,839
- − Property taxes
- −$581
- − Insurance
- −$1,324
- − Repairs & maintenance
- −$1,956
- − Management
- −$1,956
- − HOA
- −$1,500
- − Depreciation
- −$7,706
- Taxable loss
- −$5,412
- Est. tax savings @ 24.0%
- +$1,299
- After-tax cash flow
- $539/yr
For passive investors: Depreciation is non-cash, so a rental often shows a tax loss while cash-flowing — sheltering income. Rental losses are passive: they offset passive income freely, and up to $25,000/yr can offset ordinary (W-2) income if you actively participate and your MAGI is under $100k (phasing out to $0 by $150k); unused losses carry forward. On sale, claimed depreciation is recaptured at up to 25%, and gains may owe capital-gains tax (a 1031 exchange can defer both). Figures are a year-1 estimate at your 24.0% rate — not tax advice; consult a CPA.
Schools (NCES district)
- District
- Cumberland County
- NCES district ID
- 4700900
- Math proficiency
- 30% ▼ -10.00%
- Reading proficiency
- 31% ▼ -7.00%
- Median HH income
- $38,510
- Composite
- 25.52/100
- National rank
- #7438
- State rank
- #59 of 139 in TN
Livability — Fairfield Glade
- Score
- 61/100
- State rank
- #249
- US rank
- #17907
Category grades
Schools grade is shown separately in the Schools card above.
Census & demographics
- Census place
- Fairfield Glade, TN
- City population
- 9,270
- Population (ZIP)
- 9,270
Population outlook (Cumberland County) Hauer SSP2
- Today (2025)
- 61,344 people
- By 2030
- 62,611 · +2.1%
- By 2040
- 64,547 · +5.2%
- By 2050
- 65,462 · +6.7%
- By 2075
- 66,839 · +9.0%
- By 2100
- 63,855 · +4.1%
Race, ethnicity, and origin ACS 2023
- Neighborhood character
- Predominantly White (94%)
- Race & ethnicity
- White 94% Hispanic / Latino 3% Two or more races 3% Asian 1%
- Common ancestry
- Romanian 4% Slovak 4% Lithuanian 3%
- Foreign-born
- 2% · Canada
- Languages at home
- 98% English-only · Spanish 1% Other Asian/Pacific 1%
Political lean MEDSL · Cumberland
- 2024 margin
- Solid R (+58.9) · D 20.2% · R 79.1%
- 2008→2024 swing
- -21.8pp toward R · 2008: -37.1pp · 2024: -58.9pp
- All cycles
- 2024: R+58.9 2020: R+57.1 2016: R+57.8 2012: R+49.1 2008: R+37.1
Not yet ingested
- Civics
- —
Market trends
- HPI YoY
- ▼ -2.06%
- Current HPI
- 261.4637
- Rent YoY
- —
- Metro
- —
- State GDP YoY
- ▲ 2.78%
- F500 in state
- 22
Industry mix (Fortune 500 HQ in TN)
| Industry | F500 HQs | Revenue |
|---|---|---|
| Healthcare | 3 | $91B |
|
||
| Retail | 3 | $72B |
|
||
| Transportation / Logistics | 1 | $88B |
|
||
| Paper / Packaging | 1 | $19B |
|
||
| Insurance | 1 | $13B |
|
||
| Energy | 1 | $12B |
|
||
Price history
+150.6% since first listed15 events — show timeline
- 2026-03-06 Listed $264,900 Knoxville MLS
- 2025-11-01 Listing Removed — Knoxville MLS
- 2025-08-28 Price Changed $274,900 Knoxville MLS
- 2025-04-03 Listed $279,500 Knoxville MLS
- 2009-04-06 Listed $149,000 Knoxville MLS
- 2005-03-14 Sold (Public Records) $128,000 Public Records
- 2005-03-11 Sold (MLS) $128,000 Knoxville MLS
- 2005-02-07 Listed $130,000 Knoxville MLS
- 2004-11-18 Sold (Public Records) $127,000 Public Records
- 2004-11-15 Sold (MLS) $127,000 Knoxville MLS
- 2004-05-10 Listed $128,900 Knoxville MLS
- 2002-12-24 Sold (Public Records) $114,000 Public Records
- 2001-11-01 Listed $119,000 Knoxville MLS
- 1998-06-30 Sold (Public Records) $113,000 Public Records
- 1996-10-09 Sold (Public Records) $105,700 Public Records
Property tax history
+1.9%/yrLatest (2025): $581 · +0.5% YoY. Source: county tax records.
Cash-flow waterfall
monthlySold comps — $/sqft
last 12 mo · ≤1 miLoading sold comps…