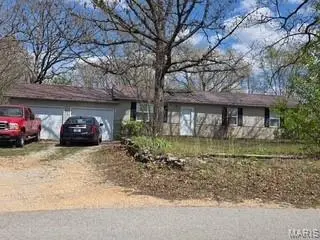
22040 Harlan Ln
St. Robert, MO 65584
$195,000D
3 bd · 1.0 ba ·
1,152 sqft ·
Built 1986
· Other
· Active
· 50 DOM
Cashflow @ list (25.0% down · 7.5%)
Estimated rent
$1,440/mo
Mortgage (P&I)
−$1,023
Tax + insurance
−$140
HOA
−$0
Vac / Maint / Mgmt
−$302
Net cashflow
$-25/mo
Annual
$-302/yr
Cap rate
6.14%
Cash-on-cash
-0.55%
DSCR
0.98
1% rule
0.74%
Cash to close
$54,600
Investor read
- This is a 3-bed/1.0-bath other listed at $195k.
- At list price, monthly cash flow is $-25 ($-302/yr) — negative.
- To cash-flow at today's rent, offer at most $191k (2.3% below list).
- To meet the 1% rule (rent ≥ 1% of price), the offer needs to be $144k (26.2% below list).
- It's been on market 50 days — a 3% lower offer ($189k) is reasonable based on typical stale-listing flexibility.
- Recommended offer: $144k (26.2% below list) — sets the bar for 1% rule.
- Local home prices are declining (-3.0%/yr); year-one equity from $1k of loan paydown is wiped out by about $6k of value loss. Plan a longer hold.
- Location reads: area grade D — affects rentability + tenant quality, not the cash-flow math above.
- Waynesville R-VI (town): math 46% / reading 53% proficiency, ranked #41 of 324 in MO (top 13%) — families likely to look elsewhere, expect single-tenant / working-renter base with shorter leases.
- Zoned schools: Freedom Elem. (math 44% / reading 45%, grade F, #413 of 1,115 statewide, top 42%, 961 students, 54% FRL); Waynesville Sr. High (math 37% / reading 53%, grade D-, #176 of 521 statewide, top 34%, 1,704 students, 39% FRL) — zoned schools average 46% FRL vs 28% district-wide (18 pts higher); higher-poverty schools than district average — tighter screening recommended.
- Market conditions: Rents rising fast (+10.2%/yr); 130 active listings in the ZIP; 62 units permitted in Pulaski County in 2024 (0 in 5+ unit buildings).
- 4 sale attempts since 7y ago with the ask held roughly flat each time — persistent listings suggest the price (not the market) is what's stuck; bring a comps-based counter.
- Cap rate 6.1% vs local median 4.4% in St. Robert — top-decile yield for the area; either an underpriced asset or a hidden risk that comps aren't pricing in. Stress-test before assuming the spread holds.
Questions for listing agent
- What do current leases actually rent for vs. the listed asking? Can we see a recent rent roll and the last 12 months of T-12 income?
- It's been on market 50 days. Have you received any prior offers? Is the seller open to a 26% concession, seller financing, or rate buy-down credit?
- Is there a deadline driving the sale (1031 exchange, divorce, estate, relocation)? That informs how much negotiation room exists.
- The area grade is low — what's the realistic commute time and amenity access for the typical tenant pool here? Any planned neighborhood developments (good or bad) we should know about?
- What's the average days-on-market for RENTAL listings here right now (not sales)? A rising rental-DOM trend means longer vacancies and softer asking-rent achievability than the comps imply.
- What's the recent tenant-quality profile in this submarket — average credit score on applications, eviction rate, late-payment / NSF rate, and stable-employment percentage? A property-management company in the area should have these aggregated.
- How much new for-sale + rental construction is in the pipeline within 1–3 miles? Heavy new supply typically softens prices + rents 12–24 months out; constrained supply supports both.
CashFlowRE · CFR-JS0F3N6V5EZFG6
· Data 1 day ago
cashflowre.app · 2026-05-29