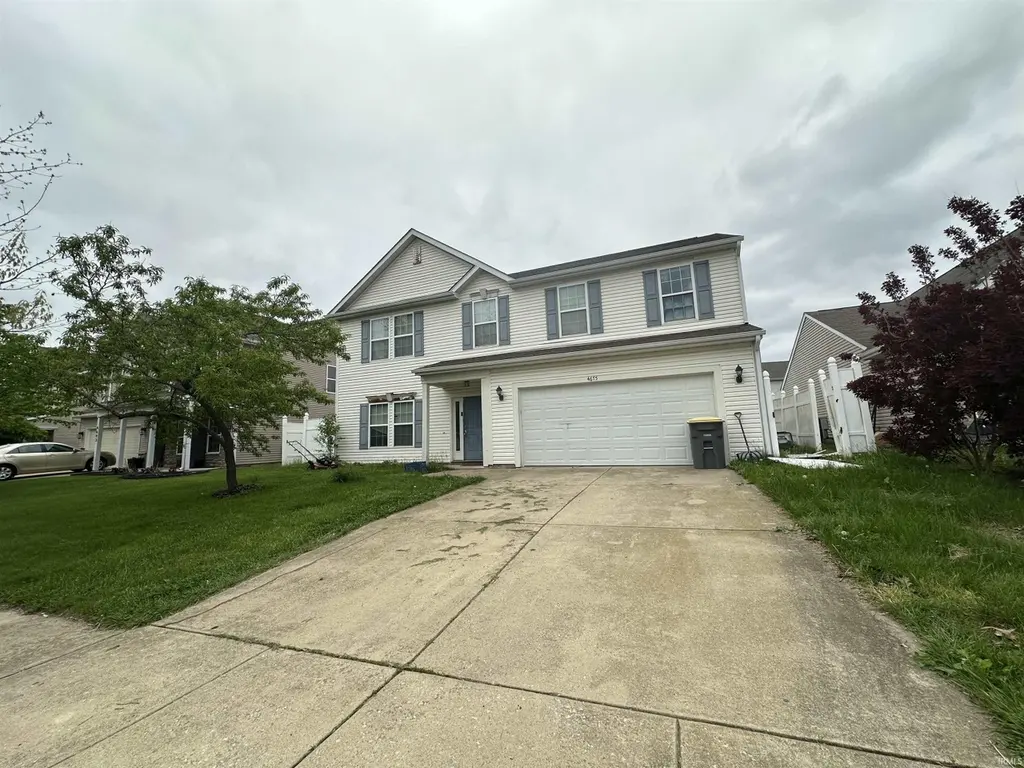
4675 Elijah St
West Lafayette, IN 47906
$284,900D+
4 bd · 2.5 ba ·
2,112 sqft ·
Built 2005
· SingleFamily
· Pending
Cashflow @ list (25.0% down · 7.5%)
Estimated rent
$2,150/mo
Mortgage (P&I)
−$1,494
Tax + insurance
−$243
HOA
−$0
Vac / Maint / Mgmt
−$452
Net cashflow
$-39/mo
Annual
$-465/yr
Cap rate
6.13%
Cash-on-cash
-0.58%
DSCR
0.97
1% rule
0.75%
Cash to close
$79,772
Investor read
- This is a 4-bed/2.5-bath single-family listed at $285k.
- At list price, monthly cash flow is $-39 ($-465/yr) — negative.
- To cash-flow at today's rent, offer at most $278k (2.4% below list).
- To meet the 1% rule (rent ≥ 1% of price), the offer needs to be $215k (24.5% below list).
- Only 0 days on market — expect competitive offers; lowballing is unlikely to land.
- Recommended offer: $215k (24.5% below list) — sets the bar for 1% rule.
- Local home prices are declining (-3.0%/yr); year-one equity from $2k of loan paydown is wiped out by about $9k of value loss. Plan a longer hold.
- Location reads 90/100 on livability (#1 in IN, #74 nationally) — a professional / high-income tenant draw. Strengths: crime A+, amenities A+, commute A+; Watch: housing C-, employment D.
- Tippecanoe School Corporation (rural): math 44% / reading 49% proficiency, ranked #80 of 301 in IN (top 27%) — families likely to look elsewhere, expect single-tenant / working-renter base with shorter leases.
- Zoned schools: Battle Ground Elementary School (math 57% / reading 59%, grade C+, #160 of 994 statewide, top 17%, 644 students, 38% FRL); Battle Ground Middle School (math 36% / reading 50%, grade D-, #92 of 330 statewide, top 29%, 739 students, 36% FRL); William Henry Harrison High School (math 53% / reading 73%, grade B-, #39 of 369 statewide, top 11%, 2,136 students, 30% FRL) — zoned schools at 35% FRL track the district average.
- Market conditions: Rents rising (+3.2%/yr); 342 active listings in the ZIP; 1 comparable units currently listed for rent nearby; 1,341 units permitted in Tippecanoe County in 2024 (869 in 5+ unit buildings).
- Tippecanoe County population projected at +41% by 2050 — long-run rental-demand tailwind backs the buy-and-hold thesis.
- Cap rate 6.1% vs local median 3.0% in West Lafayette — top-decile yield for the area; either an underpriced asset or a hidden risk that comps aren't pricing in. Stress-test before assuming the spread holds.
- At $2,150/mo this rent would consume 49% of the median local household income ($53k/yr) (locally 5978% of renters already pay >50% of income on rent) — very limited rent-growth headroom before tenants either downsize or default.
Questions for listing agent
- What do current leases actually rent for vs. the listed asking? Can we see a recent rent roll and the last 12 months of T-12 income?
- Is there a deadline driving the sale (1031 exchange, divorce, estate, relocation)? That informs how much negotiation room exists.
- Schools are A-rated — typically a magnet for longer-tenancy family renters. What's the average tenant stay here, and is there a school-zone premium baked into asking?
- The area grade is low — what's the realistic commute time and amenity access for the typical tenant pool here? Any planned neighborhood developments (good or bad) we should know about?
- What's the average days-on-market for RENTAL listings here right now (not sales)? A rising rental-DOM trend means longer vacancies and softer asking-rent achievability than the comps imply.
- What's the recent tenant-quality profile in this submarket — average credit score on applications, eviction rate, late-payment / NSF rate, and stable-employment percentage? A property-management company in the area should have these aggregated.
- How much new for-sale + rental construction is in the pipeline within 1–3 miles? Heavy new supply typically softens prices + rents 12–24 months out; constrained supply supports both.
CashFlowRE · CFR-JS6W5Z6VDHADQJ
· Data 4 weeks ago
cashflowre.app · 2026-05-29