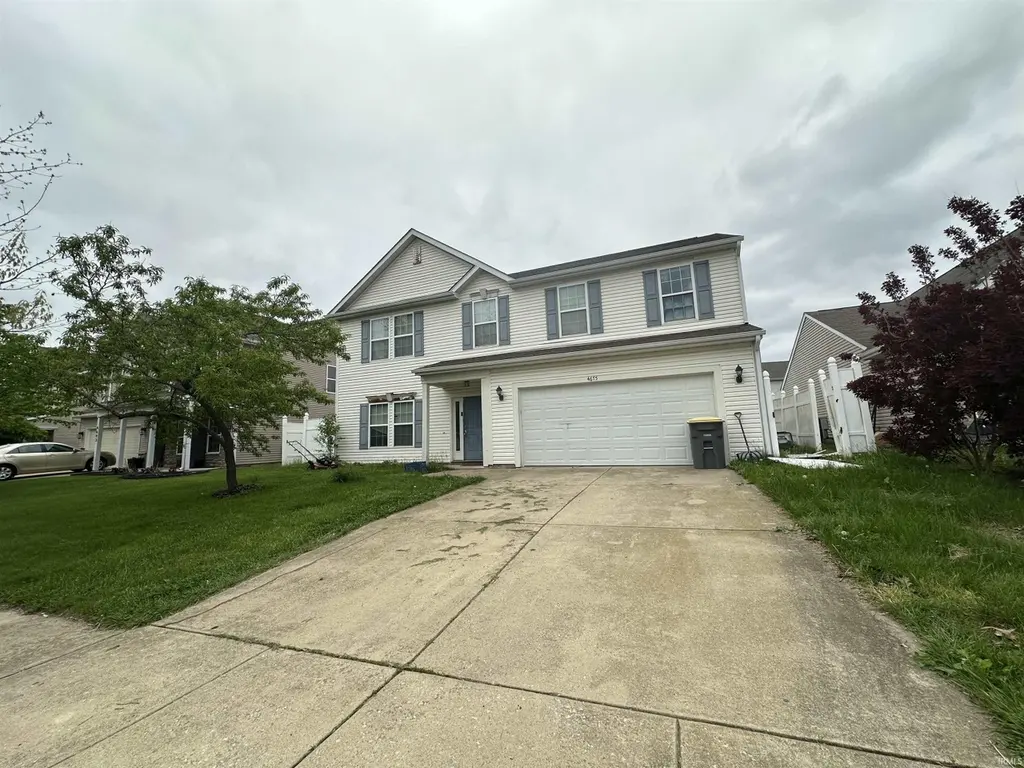
4675 Elijah St · West Lafayette, IN
Flood risk 1/10 · Minimal
- FEMA flood zone
- X (unshaded)
- Chance of flooding over 30 yrs
- 0.0%
- Est. flood insurance / yr
- $507 – $1,088
Fire risk 1/10 · Minimal
- Est. fire insurance / yr
- $717 – $1,331
Heat risk 3/10 · Minor
- Hot days now (above 102°F)
- 7 days/yr
- Hot days in 30 yrs
- 18 days/yr
Wind risk 2/10 · Minimal
- Chance of severe wind over 30 yrs
- —
Air-quality risk 2/10 · Minimal
- Unhealthy air days now
- 1 days/yr
- Unhealthy air days in 30 yrs
- 2 days/yr
Risk factors via First Street. Map © Google.
Why this score? — see what drove the D+ grade
The composite is a weighted blend of 9 inputs, each scored 0–100. Each bar is that input's sub-score; the figure is the points it added to the 100-point composite (weight × sub-score).
- ARV discount +15.0/15.0
- Cash flow +12.6/30.0
- Livability +4.5/5.0
- Schools +4.0/10.0
- DSCR +3.7/10.0
- Rent growth +3.3/5.0
- 1% rule +2.5/10.0
- Condition / age +2.5/5.0
- Appreciation +0.0/10.0
$284,900
🖨 Deal sheet (PDF) 📄 Offer letter ✓ Due diligence
Listing remarks
Your next great investment opportunity starts here. Welcome to 4675 Elijah St located in the established subdivision of Phophets Ridge. With great upside potential, this is a property you don't want to miss on.
Key facts
- 6,316 sq ft lot
- 2 garage spots
- Built 2005
Neighborhood map
What this means for you Summary
Snapshot
- This is a 4-bed/2.5-bath single-family listed at $285k.
Deal economics
- At list price, monthly cash flow is $-39 ($-465/yr) — negative.
- To cash-flow at today's rent, offer at most $278k (2.4% below list).
- To meet the 1% rule (rent ≥ 1% of price), the offer needs to be $215k (24.5% below list).
- Recommended offer: $215k (24.5% below list) — sets the bar for 1% rule.
- Cap rate 6.1% vs local median 3.0% in West Lafayette — top-decile yield for the area; either an underpriced asset or a hidden risk that comps aren't pricing in. Stress-test before assuming the spread holds.
Location & tenants
- Location reads 90/100 on livability (#1 in IN, #74 nationally) — a professional / high-income tenant draw. Strengths: crime A+, amenities A+, commute A+; Watch: housing C-, employment D.
- Tippecanoe School Corporation (rural): math 44% / reading 49% proficiency, ranked #80 of 301 in IN (top 27%) — families likely to look elsewhere, expect single-tenant / working-renter base with shorter leases.
- Zoned schools: Battle Ground Elementary School (math 57% / reading 59%, grade C+, #160 of 994 statewide, top 17%, 644 students, 38% FRL); Battle Ground Middle School (math 36% / reading 50%, grade D-, #92 of 330 statewide, top 29%, 739 students, 36% FRL); William Henry Harrison High School (math 53% / reading 73%, grade B-, #39 of 369 statewide, top 11%, 2,136 students, 30% FRL) — zoned schools at 35% FRL track the district average.
- Market conditions: Rents rising (+3.2%/yr); 342 active listings in the ZIP; 1 comparable units currently listed for rent nearby; 1,341 units permitted in Tippecanoe County in 2024 (869 in 5+ unit buildings).
- At $2,150/mo this rent would consume 49% of the median local household income ($53k/yr) (locally 5978% of renters already pay >50% of income on rent) — very limited rent-growth headroom before tenants either downsize or default.
Forward outlook
- Local home prices are declining (-3.0%/yr); year-one equity from $2k of loan paydown is wiped out by about $9k of value loss. Plan a longer hold.
- Tippecanoe County population projected at +41% by 2050 — long-run rental-demand tailwind backs the buy-and-hold thesis.
Negotiation context
- Only 0 days on market — expect competitive offers; lowballing is unlikely to land.
Questions for the listing agent
- What do current leases actually rent for vs. the listed asking? Can we see a recent rent roll and the last 12 months of T-12 income?
- Is there a deadline driving the sale (1031 exchange, divorce, estate, relocation)? That informs how much negotiation room exists.
- Schools are A-rated — typically a magnet for longer-tenancy family renters. What's the average tenant stay here, and is there a school-zone premium baked into asking?
- The area grade is low — what's the realistic commute time and amenity access for the typical tenant pool here? Any planned neighborhood developments (good or bad) we should know about?
- What's the average days-on-market for RENTAL listings here right now (not sales)? A rising rental-DOM trend means longer vacancies and softer asking-rent achievability than the comps imply.
- What's the recent tenant-quality profile in this submarket — average credit score on applications, eviction rate, late-payment / NSF rate, and stable-employment percentage? A property-management company in the area should have these aggregated.
- How much new for-sale + rental construction is in the pipeline within 1–3 miles? Heavy new supply typically softens prices + rents 12–24 months out; constrained supply supports both.
Investment metrics
- 1% rule
- 0.75% ✗
- Cap rate
- 6.13%
- Cash-on-cash
- -0.58%
- DSCR
- 0.97
- GRM
- 11.0
CMA / ARV
- ARV (on-the-fly)
- $394,944
- Comps found
- 12
Show comp detail 12 sales within ~0.75 mi
| Address | Dist | Beds/Ba | Sqft | Sold | Price | $/sf | Match |
|---|---|---|---|---|---|---|---|
| 4675 Elijah St | 0.00mi | 4/2.5 | 2,112 (0%) | 1mo | $252,500 | $120 | 99 |
| 567 Isaiah St | 0.10mi | 4/2.5 | 2,059 (-2%) | 1mo | $340,000 | $165 | 90 |
| 757 Matthew St | 0.16mi | 3/2.5 (-1) | 2,121 (+0%) | 5mo | $325,000 | $153 | 83 |
| 228 Aqueduct Cir | 0.21mi | 3/2.0 (-1) | 2,074 (-2%) | 1mo | $425,000 | $205 | 79 |
| 587 Elijah St | 0.08mi | 4/2.5 | 2,203 (+4%) | 12mo | $340,000 | $154 | 79 |
| 4562 Matthew St | 0.14mi | 4/2.5 | 2,000 (-5%) | 13mo | $319,900 | $160 | 74 |
| 4578 Matthew St | 0.13mi | 4/2.5 | 2,317 (+10%) | 6mo | $330,000 | $142 | 73 |
| 164 Aqueduct Cir | 0.36mi | 3/2.0 (-1) | 2,198 (+4%) | 2mo | $410,000 | $187 | 67 |
| 5337 Maize Dr | 0.67mi | 3/2.0 (-1) | 2,112 (0%) | 1mo | $475,900 | $225 | 61 |
| 224 Aqueduct Cir | 0.23mi | 3/2.0 (-1) | 1,922 (-9%) | 12mo | $375,000 | $195 | 58 |
| 4260 Demeree Way | 0.29mi | 4/3.5 | 2,427 (+15%) | 3mo | $560,000 | $231 | 56 |
| 136 Aqueduct Cir | 0.30mi | 3/2.0 (-1) | 1,838 (-13%) | 7mo | $368,500 | $200 | 52 |
Match score weights: distance 35% · size 25% · config 20% · recency 20%. Top-matched comps best support the ARV.
Projected returns pro-forma
-3.0% appreciation · 3.2% rent growth · sell at horizon
- IRR
- -17.1%
- Equity multiple
- 0.39×
- Total profit
- $-48,313
- Equity at exit
- $42,480
- IRR
- -8.8%
- Equity multiple
- 0.45×
- Total profit
- $-43,911
- Equity at exit
- $24,633
Cash invested: $79,772 (down + closing). Projections, not guarantees.
Landlord ↔ Tenant lean methodology
- Overall (STATE)
- 90 Strongly Landlord-Friendly
- State Indiana
- 90 Strongly Landlord-Friendly · R+11
- County
- — inherits STATE
- City
- — inherits STATE
ZIP-level market 47906
- Rents YoY
- 3.2%
- Active inventory
- 342
- Price-to-rent
- 11.0×
Monthly cashflow live
- Estimated rent
- $2,150 medium interval (Pro) →
- Mortgage (P&I)
- −$1,494
- Tax from tax record
- −$125 /mo · $1,495/yr
- Insurance
- −$119
- HOA
- −$0
- Vacancy / Maint / Mgmt
- −$452
- Net cashflow
- $-39
Break-even live
Sensitivity live
| Price | -10% $122 | -5% $42 | +0% $-39 | +5% $-119 | +10% $-200 |
|---|---|---|---|---|---|
| Rent | -10% $-209 | -5% $-124 | +0% $-39 | +5% $46 | +10% $131 |
| Rate | -1.0pp $105 | -0.5pp $34 | base $-39 | +0.5pp $-113 | +1.0pp $-188 |
UW: 25.0% down · 7.5% · 30yr · 1.5% tax · 5.0% vac · 8.0% maint · 8.0% mgmt
Financing live
Cash to close
- Down payment
- $71,225
- Closing costs
- $8,547
- Reserves months
- —
- Total cash needed
- —
Loan-product check · same deal, 3 products live
Conventional
25% down · 7.5% · 30yr
- Down + closing
- —
- Monthly P&I
- —
- Monthly cashflow
- —
- DSCR
- —
- Eligible?
- —
Personal DTI + credit; lowest rate.
DSCR
20% down · 8.5% · 30yr
- Down + closing
- —
- Monthly P&I
- —
- Monthly cashflow
- —
- DSCR
- —
- Eligible?
- —
No personal income docs; deal must DSCR.
Hard money
10% down · 12.0% · 12mo
- Down + closing
- —
- Monthly P&I
- —
- Monthly cashflow
- —
- DSCR
- —
- Eligible?
- —
Short-term bridge; refi at stabilization.
Rent comps 1 comps
| Address | Beds | Baths | Sqft | Rent | $/sqft | DOM | Units | Dist |
|---|---|---|---|---|---|---|---|---|
| 697 Matthew St West Lafayette, IN | 3.0 | 2.0 | 1625 | $2,300 | $1.42 | 45d | 1 | 0.18mi |
Listing history 2 events
-
2026-05-06historical
-
2026-05-05$284,900
ⓘ Source: listings_history table (triggers on properties + properties_extension) + one-shot
backfill from property_details.listing_events for pre-trigger history.
Tax reassessment forecast IN · Partial reset (capped growth)
- Current annual tax
- $1,495 · $125/mo
- Projected year-2 tax
- $1,959 · $163/mo
- Expected delta
- +$463/yr (+$39/mo · 31.0%)
ⓘ Screening estimate from a state-policy table — verify with the county assessor before closing.
Climate risk First Street
- Flood 1/10 Low FEMA zone X (unshaded) · 0% chance over 30 yrs
- Wildfire 1/10 Low
- Heat 3/10 Moderate 7 d/yr ≥102°F today · 18 d/yr by 30 yrs out
- Wind 2/10 Low
- Air quality 2/10 Low 1 unhealthy d/yr today · 2 by 30 yrs out
Nearby sold comps map
Loading sold comps map…
Walkable amenities ~0.75 mi
Loading nearby amenities…
Taxation est. · year 1
- Rental income
- $25,801
- − Mortgage interest
- −$15,959
- − Property taxes
- −$1,495
- − Insurance
- −$1,424
- − Repairs & maintenance
- −$2,064
- − Management
- −$2,064
- − Depreciation
- −$8,288
- Taxable loss
- −$5,494
- Est. tax savings @ 24.0%
- +$1,318
- After-tax cash flow
- $853/yr
For passive investors: Depreciation is non-cash, so a rental often shows a tax loss while cash-flowing — sheltering income. Rental losses are passive: they offset passive income freely, and up to $25,000/yr can offset ordinary (W-2) income if you actively participate and your MAGI is under $100k (phasing out to $0 by $150k); unused losses carry forward. On sale, claimed depreciation is recaptured at up to 25%, and gains may owe capital-gains tax (a 1031 exchange can defer both). Figures are a year-1 estimate at your 24.0% rate — not tax advice; consult a CPA.
Schools (NCES district)
- District
- Tippecanoe School Corporation
- NCES district ID
- 1811340
- Math proficiency
- 44% ▼ -6.00%
- Reading proficiency
- 49% ▼ -5.00%
- Median HH income
- $55,087
- Composite
- 40.36/100
- National rank
- #3741
- State rank
- #80 of 301 in IN
Livability — West Lafayette
- Score
- 90/100
- State rank
- #1
- US rank
- #74
Category grades
Schools grade is shown separately in the Schools card above.
Census & demographics
- Census place
- West Lafayette, IN
- County
- Tippecanoe County · 181,820 people
- City population
- 75,198
- Metro
- Lafayette-West Lafayette, IN
- Population (ZIP)
- 75,198
- Household income
- $53,103
- Rent vs Own
- Severe rent burden
- 5978.0
Population outlook (Tippecanoe County) Hauer SSP2
- Today (2025)
- 215,327 people
- By 2030
- 232,284 · +7.9%
- By 2040
- 266,517 · +23.8%
- By 2050
- 302,826 · +40.6%
- By 2075
- 394,445 · +83.2%
- By 2100
- 463,500 · +115.3%
Race, ethnicity, and origin ACS 2023
- Neighborhood character
- Predominantly White (69%)
- Race & ethnicity
- White 69% Asian 16% Hispanic / Latino 7% Two or more races 5% Black 5%
- Hispanic origin (detail)
- Mexican 4%
- Common ancestry
- Romanian 4% Slovak 3% Italian 2%
- Foreign-born
- 18% · China, Canada, South Korea
- Languages at home
- 79% English-only · Chinese 5% Spanish 4% Other Indo-European 4%
Political lean MEDSL · Tippecanoe
- 2024 margin
- Toss-up / Even · D 49.0% · R 49.1% · Other 1.9%
- 2008→2024 swing
- -11.8pp toward R · 2008: 11.6pp · 2024: -0.1pp
- All cycles
- 2024: R+0.1 2020: D+0.6 2016: R+5.7 2012: R+3.6 2008: D+11.6
Not yet ingested
- Civics
- —
Market trends
- HPI YoY
- ▼ -134.80%
- Current HPI
- 210.545
- Rent YoY
- ▲ 3.20%
- Metro
- Lafayette-West Lafayette, IN
- State GDP YoY
- ▲ 2.90%
- F500 in state
- 18
Industry mix (Fortune 500 HQ in IN)
| Industry | F500 HQs | Revenue |
|---|---|---|
| Industrial Machinery | 2 | $37B |
|
||
| Healthcare | 1 | $177B |
|
||
| Pharmaceuticals | 1 | $45B |
|
||
| Metals / Steel | 1 | $18B |
|
||
| Agriculture | 1 | $17B |
|
||
| Packaging | 1 | $12B |
|
||
Price history
2 events — show timeline
- 2026-05-06 Delisted — IRMLS
- 2026-05-05 Listed $284,900 IRMLS
Property tax history
+16.3%/yrLatest (2024): $1,495 · +17.0% YoY. Source: county tax records.
Cash-flow waterfall
monthlySold comps — $/sqft
last 12 mo · ≤1 miLoading sold comps…