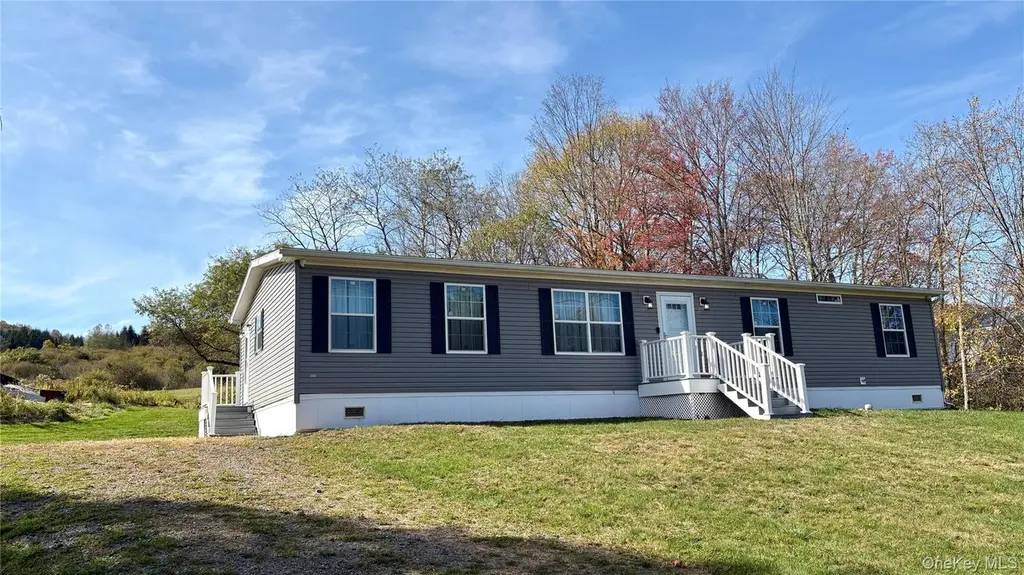
4188 State Route 52
Jeffersonville, NY 12791
$299,900D
4 bd · 2.0 ba ·
1,620 sqft ·
Built 2021
· SingleFamily
· Pending
· 47 DOM
Cashflow @ list (25.0% down · 7.5%)
Estimated rent
$1,504/mo
Mortgage (P&I)
−$1,573
Tax + insurance
−$486
HOA
−$0
Vac / Maint / Mgmt
−$316
Net cashflow
$-870/mo
Annual
$-10,445/yr
Cap rate
2.81%
Cash-on-cash
-12.44%
DSCR
0.45
1% rule
0.50%
Cash to close
$83,972
Investor read
- This is a 4-bed/2.0-bath single-family listed at $300k.
- At list price, monthly cash flow is $-870 ($-10k/yr) — negative.
- To cash-flow at today's rent, offer at most $146k (51.3% below list).
- To meet the 1% rule (rent ≥ 1% of price), the offer needs to be $150k (49.8% below list).
- It's been on market 47 days — a 3% lower offer ($291k) is reasonable based on typical stale-listing flexibility.
- Recommended offer: $146k (51.3% below list) — sets the bar for cash-flow.
- In year one you build about $30k of equity ($2k loan paydown + $28k appreciation (9.3% local appreciation)).
- Location reads 61/100 on livability (#909 in NY) — a middle-class / working-renter tenant base. Strengths: cost of living A+, housing A+, employment B; Watch: crime D-, amenities F, commute F.
- Sullivan West Central School District (rural): math 45% / reading 47% proficiency, ranked #436 of 590 in NY (top 74%) — families likely to look elsewhere, expect single-tenant / working-renter base with shorter leases.
- Zoned schools: Sullivan West Elementary School (math 41% / reading 48%, grade F, #1,277 of 2,108 statewide, top 64%, 571 students, 37% FRL); Sullivan West High School At Lake Huntington (math 52% / reading 47%, grade D, #974 of 1,100 statewide, top 91%, 477 students, 39% FRL).
- Market conditions: 5 active listings in the ZIP; 739 units permitted in Sullivan County in 2024 (5 in 5+ unit buildings).
- Sullivan County population projected at -24% by 2050 — secular population decline; favor cash flow + early exit over multi-decade hold.
- 2 sale attempts with the ask held roughly flat each time — persistent listings suggest the price (not the market) is what's stuck; bring a comps-based counter.
- By year 2, paydown + projected appreciation supports a ~$48k cash-out refi (75% LTV) — recoverable capital for the next deal without selling this one.
- Cap rate 2.8% vs local median 2.2% in Jeffersonville — meaningfully above typical; check what's discounted (condition, days-on-market, listing class) to confirm the premium yield is real.
Questions for listing agent
- What do current leases actually rent for vs. the listed asking? Can we see a recent rent roll and the last 12 months of T-12 income?
- It's been on market 47 days. Have you received any prior offers? Is the seller open to a 51% concession, seller financing, or rate buy-down credit?
- Is there a deadline driving the sale (1031 exchange, divorce, estate, relocation)? That informs how much negotiation room exists.
- Schools are D-rated, which usually means shorter tenancies and higher turnover. Who's the typical renter profile here, and what's been the actual vacancy rate?
- Crime grade is D in this area — have there been break-ins, vandalism, or insurance claims at this property in the last 3 years? What carrier currently insures it and at what premium?
- The area grade is low — what's the realistic commute time and amenity access for the typical tenant pool here? Any planned neighborhood developments (good or bad) we should know about?
- What's the average days-on-market for RENTAL listings here right now (not sales)? A rising rental-DOM trend means longer vacancies and softer asking-rent achievability than the comps imply.
- What's the recent tenant-quality profile in this submarket — average credit score on applications, eviction rate, late-payment / NSF rate, and stable-employment percentage? A property-management company in the area should have these aggregated.
CashFlowRE · CFR-JS89A53HKXEM0R
· Data 1 week ago
cashflowre.app · 2026-05-29