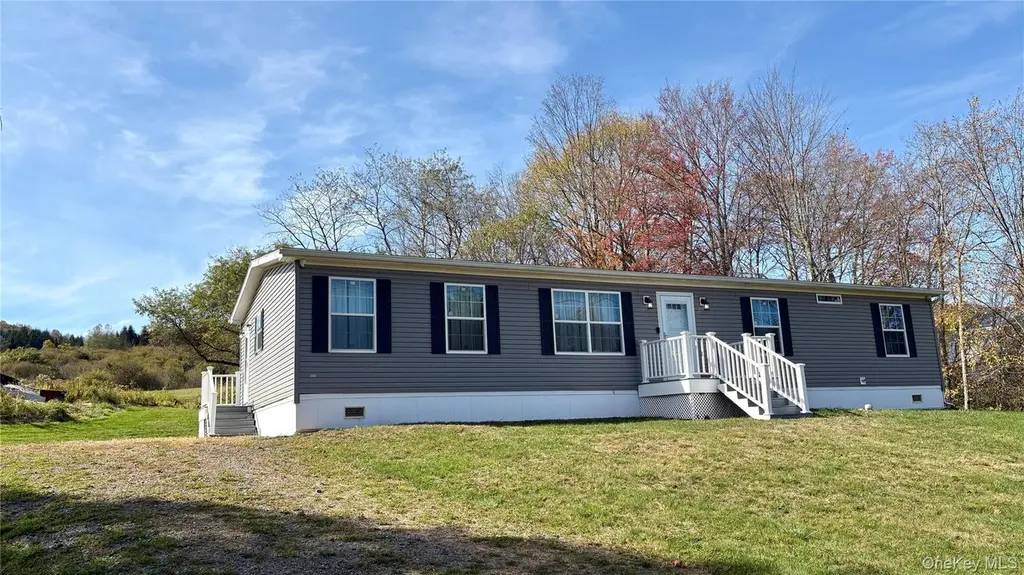
4188 State Route 52 · Jeffersonville, NY
Flood risk 1/10 · Minimal
- FEMA flood zone
- X (unshaded)
- Chance of flooding over 30 yrs
- 0.0%
- Est. flood insurance / yr
- $507 – $1,088
Fire risk 3/10 · Minor
- Est. fire insurance / yr
- $691 – $1,283
Heat risk 3/10 · Minor
- Hot days now (above 92°F)
- 7 days/yr
- Hot days in 30 yrs
- 17 days/yr
Wind risk 2/10 · Minimal
- Chance of severe wind over 30 yrs
- 3.0%
Air-quality risk 2/10 · Minimal
- Unhealthy air days now
- 0 days/yr
- Unhealthy air days in 30 yrs
- 1 days/yr
Risk factors via First Street. Map © Google.
Why this score? — see what drove the D grade
The composite is a weighted blend of 9 inputs, each scored 0–100. Each bar is that input's sub-score; the figure is the points it added to the 100-point composite (weight × sub-score).
- ARV discount +15.0/15.0
- Appreciation +9.7/10.0
- Schools +4.0/10.0
- Cash flow +3.8/30.0
- Livability +3.1/5.0
- Rent growth +2.5/5.0
- Condition / age +2.5/5.0
- 1% rule +0.0/10.0
- DSCR +0.0/10.0
$299,900
🖨 Deal sheet (PDF) 📄 Offer letter ✓ Due diligence
Listing remarks
Mobile-home in very good condition set on one acre just outside Youngsville NY. Many amenities and quality upgrades went into this 4 bedroom 2 full bath home. There are stainless kitchen appliances and a large kitchen island with plenty of cabinetry. Laundry room with washer and dryer. It has is central air and heat (propane), an alarm system, camera system for security, new septic system, outside electrical outlets, outdoor hose spicket (front and back of house) and a large deck to enjoy the view from in the back. Convenient location to everything Sullivan County has to offer.
Key facts
- Large kitchen island
- Alarm system
- Camera system
Tags
Property features AI
Exterior
- Parking: Driveway (private, unpaved); No carport
- Security: Building security; Video cameras
- Utilities: Septic tank; Cable connected; Electricity connected; Propane
- Home design: Double wide manufactured home; Mobile home property subtype; Living area reported from public records
- Construction: Manufactured/ mobile home construction; Property condition: actual
- Exterior features: Building security; Video cameras; Not waterfront
Interior
- Kitchen: Dishwasher; Microwave; Oven; Range; Refrigerator; Stainless steel appliances
- Bedrooms: Total rooms: 9
- Bathrooms: 2 full bathrooms
- Heating & cooling: Central air conditioning; Hot air heating
- Interior features: First-floor bedroom; Breakfast bar; Kitchen island; Open floorplan; Primary bathroom; Washer/dryer hookup
- Laundry & utility: Washer; Dryer; Washer/dryer hookup
Neighborhood map
What this means for you Summary
Snapshot
- This is a 4-bed/2.0-bath single-family listed at $300k.
Deal economics
- At list price, monthly cash flow is $-870 ($-10k/yr) — negative.
- To cash-flow at today's rent, offer at most $146k (51.3% below list).
- To meet the 1% rule (rent ≥ 1% of price), the offer needs to be $150k (49.8% below list).
- Recommended offer: $146k (51.3% below list) — sets the bar for cash-flow.
- Cap rate 2.8% vs local median 2.2% in Jeffersonville — meaningfully above typical; check what's discounted (condition, days-on-market, listing class) to confirm the premium yield is real.
Location & tenants
- Location reads 61/100 on livability (#909 in NY) — a middle-class / working-renter tenant base. Strengths: cost of living A+, housing A+, employment B; Watch: crime D-, amenities F, commute F.
- Sullivan West Central School District (rural): math 45% / reading 47% proficiency, ranked #436 of 590 in NY (top 74%) — families likely to look elsewhere, expect single-tenant / working-renter base with shorter leases.
- Zoned schools: Sullivan West Elementary School (math 41% / reading 48%, grade F, #1,277 of 2,108 statewide, top 64%, 571 students, 37% FRL); Sullivan West High School At Lake Huntington (math 52% / reading 47%, grade D, #974 of 1,100 statewide, top 91%, 477 students, 39% FRL).
- Market conditions: 5 active listings in the ZIP; 739 units permitted in Sullivan County in 2024 (5 in 5+ unit buildings).
Forward outlook
- In year one you build about $30k of equity ($2k loan paydown + $28k appreciation (9.3% local appreciation)).
- Sullivan County population projected at -24% by 2050 — secular population decline; favor cash flow + early exit over multi-decade hold.
- By year 2, paydown + projected appreciation supports a ~$48k cash-out refi (75% LTV) — recoverable capital for the next deal without selling this one.
Negotiation context
- It's been on market 47 days — a 3% lower offer ($291k) is reasonable based on typical stale-listing flexibility.
- 2 sale attempts with the ask held roughly flat each time — persistent listings suggest the price (not the market) is what's stuck; bring a comps-based counter.
Questions for the listing agent
- What do current leases actually rent for vs. the listed asking? Can we see a recent rent roll and the last 12 months of T-12 income?
- It's been on market 47 days. Have you received any prior offers? Is the seller open to a 51% concession, seller financing, or rate buy-down credit?
- Is there a deadline driving the sale (1031 exchange, divorce, estate, relocation)? That informs how much negotiation room exists.
- Schools are D-rated, which usually means shorter tenancies and higher turnover. Who's the typical renter profile here, and what's been the actual vacancy rate?
- Crime grade is D in this area — have there been break-ins, vandalism, or insurance claims at this property in the last 3 years? What carrier currently insures it and at what premium?
- The area grade is low — what's the realistic commute time and amenity access for the typical tenant pool here? Any planned neighborhood developments (good or bad) we should know about?
- What's the average days-on-market for RENTAL listings here right now (not sales)? A rising rental-DOM trend means longer vacancies and softer asking-rent achievability than the comps imply.
- What's the recent tenant-quality profile in this submarket — average credit score on applications, eviction rate, late-payment / NSF rate, and stable-employment percentage? A property-management company in the area should have these aggregated.
- How much new for-sale + rental construction is in the pipeline within 1–3 miles? Heavy new supply typically softens prices + rents 12–24 months out; constrained supply supports both.
Investment metrics
- 1% rule
- 0.50% ✗
- Cap rate
- 2.81%
- Cash-on-cash
- -12.44%
- DSCR
- 0.45
- GRM
- 16.6
CMA / ARV
- ARV (median comp)
- $545,707
- List price
- $299,900
- Delta
- -45.04%
- Verdict
- UNDERPRICED
- Comps
- 13 within 1.0 mi
Show comp detail 2 sales within ~0.75 mi
| Address | Dist | Beds/Ba | Sqft | Sold | Price | $/sf | Match |
|---|---|---|---|---|---|---|---|
| 271 Hemmer Rd | 0.68mi | 3/2.0 (-1) | 1,626 (+0%) | 9mo | $505,000 | $311 | 56 |
| 231 Boband Rd | 0.66mi | 3/2.0 (-1) | 1,400 (-14%) | 6mo | $575,000 | $411 | 36 |
Match score weights: distance 35% · size 25% · config 20% · recency 20%. Top-matched comps best support the ARV.
Projected returns pro-forma
9.32% appreciation · 3.0% rent growth · sell at horizon
- IRR
- 14.0%
- Equity multiple
- 2.12×
- Total profit
- $93,965
- Equity at exit
- $255,336
- IRR
- 14.0%
- Equity multiple
- 4.78×
- Total profit
- $317,172
- Equity at exit
- $535,582
Cash invested: $83,972 (down + closing). Projections, not guarantees.
Landlord ↔ Tenant lean methodology
- Overall (STATE)
- 15 Strongly Tenant-Friendly
- State New York
- 15 Strongly Tenant-Friendly · D+10
- County
- — inherits STATE
- City
- — inherits STATE
ZIP-level market 12791
- Home prices YoY
- 2.9%
- Active inventory
- 5
- Price-to-rent
- 16.6×
Monthly cashflow live
- Estimated rent
- $1,504 medium interval (Pro) →
- Mortgage (P&I)
- −$1,573
- Tax from tax record
- −$361 /mo · $4,334/yr
- Insurance
- −$125
- HOA
- −$0
- Vacancy / Maint / Mgmt
- −$316
- Net cashflow
- $-870
Break-even live
Sensitivity live
| Price | -10% $-701 | -5% $-786 | +0% $-870 | +5% $-955 | +10% $-1,040 |
|---|---|---|---|---|---|
| Rent | -10% $-989 | -5% $-930 | +0% $-870 | +5% $-811 | +10% $-752 |
| Rate | -1.0pp $-719 | -0.5pp $-794 | base $-870 | +0.5pp $-948 | +1.0pp $-1,027 |
UW: 25.0% down · 7.5% · 30yr · 1.5% tax · 5.0% vac · 8.0% maint · 8.0% mgmt
Financing live
Cash to close
- Down payment
- $74,975
- Closing costs
- $8,997
- Reserves months
- —
- Total cash needed
- —
Loan-product check · same deal, 3 products live
Conventional
25% down · 7.5% · 30yr
- Down + closing
- —
- Monthly P&I
- —
- Monthly cashflow
- —
- DSCR
- —
- Eligible?
- —
Personal DTI + credit; lowest rate.
DSCR
20% down · 8.5% · 30yr
- Down + closing
- —
- Monthly P&I
- —
- Monthly cashflow
- —
- DSCR
- —
- Eligible?
- —
No personal income docs; deal must DSCR.
Hard money
10% down · 12.0% · 12mo
- Down + closing
- —
- Monthly P&I
- —
- Monthly cashflow
- —
- DSCR
- —
- Eligible?
- —
Short-term bridge; refi at stabilization.
Listing history 8 events
-
2026-06-07statusdays on market $299,900 Pending 47 DOM
-
2026-06-04days on market $299,900 Active 46 DOM
-
2026-06-02days on market $299,900 Active 45 DOM
-
2026-06-01days on market $299,900 Active 44 DOM
-
2026-05-31days on market $299,900 Active 43 DOM
-
2026-04-18$299,900 Active 584-char remark
-
2025-10-29historical
-
2025-10-06$339,000 Active
ⓘ Source: listings_history table (triggers on properties + properties_extension) + one-shot
backfill from property_details.listing_events for pre-trigger history.
Tax reassessment forecast NY · Partial reset (capped growth)
- Current annual tax
- $4,334 · $361/mo
- Projected year-2 tax
- $4,701 · $392/mo
- Expected delta
- +$367/yr (+$31/mo · 8.5%)
ⓘ Screening estimate from a state-policy table — verify with the county assessor before closing.
Climate risk First Street
- Flood 1/10 Low FEMA zone X (unshaded) · 0% chance over 30 yrs
- Wildfire 3/10 Moderate
- Heat 3/10 Moderate 7 d/yr ≥92°F today · 17 d/yr by 30 yrs out
- Wind 2/10 Low 3% chance of damaging wind over 30 yrs
- Air quality 2/10 Low 0 unhealthy d/yr today · 1 by 30 yrs out
Nearby sold comps map
Loading sold comps map…
Walkable amenities ~0.75 mi
Loading nearby amenities…
Taxation est. · year 1
- Rental income
- $18,052
- − Mortgage interest
- −$16,799
- − Property taxes
- −$4,334
- − Insurance
- −$1,500
- − Repairs & maintenance
- −$1,444
- − Management
- −$1,444
- − Depreciation
- −$8,724
- Taxable loss
- −$16,193
- Est. tax savings @ 24.0%
- +$3,886
- After-tax cash flow
- $-6,558/yr
For passive investors: Depreciation is non-cash, so a rental often shows a tax loss while cash-flowing — sheltering income. Rental losses are passive: they offset passive income freely, and up to $25,000/yr can offset ordinary (W-2) income if you actively participate and your MAGI is under $100k (phasing out to $0 by $150k); unused losses carry forward. On sale, claimed depreciation is recaptured at up to 25%, and gains may owe capital-gains tax (a 1031 exchange can defer both). Figures are a year-1 estimate at your 24.0% rate — not tax advice; consult a CPA.
Schools (NCES district)
- District
- Sullivan West Central School District
- NCES district ID
- 3600023
- Math proficiency
- 45% ▼ -7.00%
- Reading proficiency
- 47% ▼ -2.00%
- Median HH income
- $56,078
- Composite
- 40.05/100
- National rank
- #3817
- State rank
- #436 of 590 in NY
Livability — Jeffersonville
- Score
- 61/100
- State rank
- #909
- US rank
- #17767
Category grades
Schools grade is shown separately in the Schools card above.
Census & demographics
- Population (ZIP)
- 589
Population outlook (Sullivan County) Hauer SSP2
- Today (2025)
- 68,974 people
- By 2030
- 65,609 · -4.9%
- By 2040
- 58,878 · -14.6%
- By 2050
- 52,500 · -23.9%
- By 2075
- 39,941 · -42.1%
- By 2100
- 28,880 · -58.1%
Race, ethnicity, and origin ACS 2023
- Neighborhood character
- Predominantly White (90%)
- Race & ethnicity
- White 90% Hispanic / Latino 8% Two or more races 6%
- Hispanic origin (detail)
- Puerto Rican 8%
- Common ancestry
- Iranian 11% Lithuanian 1%
- Foreign-born
- 5%
- Languages at home
- 99% English-only · Other Indo-European 1%
Political lean MEDSL · Sullivan
- 2024 margin
- R (+16.7) · D 41.6% · R 58.4%
- 2008→2024 swing
- -26.2pp toward R · 2008: 9.5pp · 2024: -16.7pp
- All cycles
- 2024: R+16.7 2020: R+9.2 2016: R+13.7 2012: D+10.4 2008: D+9.5
Not yet ingested
- Civics
- —
Market trends
- HPI YoY
- ▲ 9.32%
- Current HPI
- 336.4783
- Rent YoY
- —
- Metro
- —
- State GDP YoY
- ▲ 2.60%
- F500 in state
- 92
Industry mix (Fortune 500 HQ in NY)
| Industry | F500 HQs | Revenue |
|---|---|---|
| Financial Services | 10 | $950B |
|
||
| Consumer Goods | 9 | $162B |
|
||
| Insurance | 4 | $225B |
|
||
| Telecommunications | 2 | $144B |
|
||
| Pharmaceuticals | 2 | $112B |
|
||
| Media / Entertainment | 2 | $69B |
|
||
Price history
-11.5% since first listed4 events — show timeline
- 2026-06-04 Pending — OneKey® MLS as Distributed by MLS Grid
- 2026-04-18 Listed $299,900 OneKey® MLS as Distributed by MLS Grid
- 2025-10-29 Listing Removed — OneKey® MLS as Distributed by MLS Grid
- 2025-10-06 Listed $339,000 OneKey® MLS as Distributed by MLS Grid
Property tax history
+7.9%/yrLatest (2025): $4,334 · +4.2% YoY. Source: county tax records.
Cash-flow waterfall
monthlySold comps — $/sqft
last 12 mo · ≤1 miLoading sold comps…