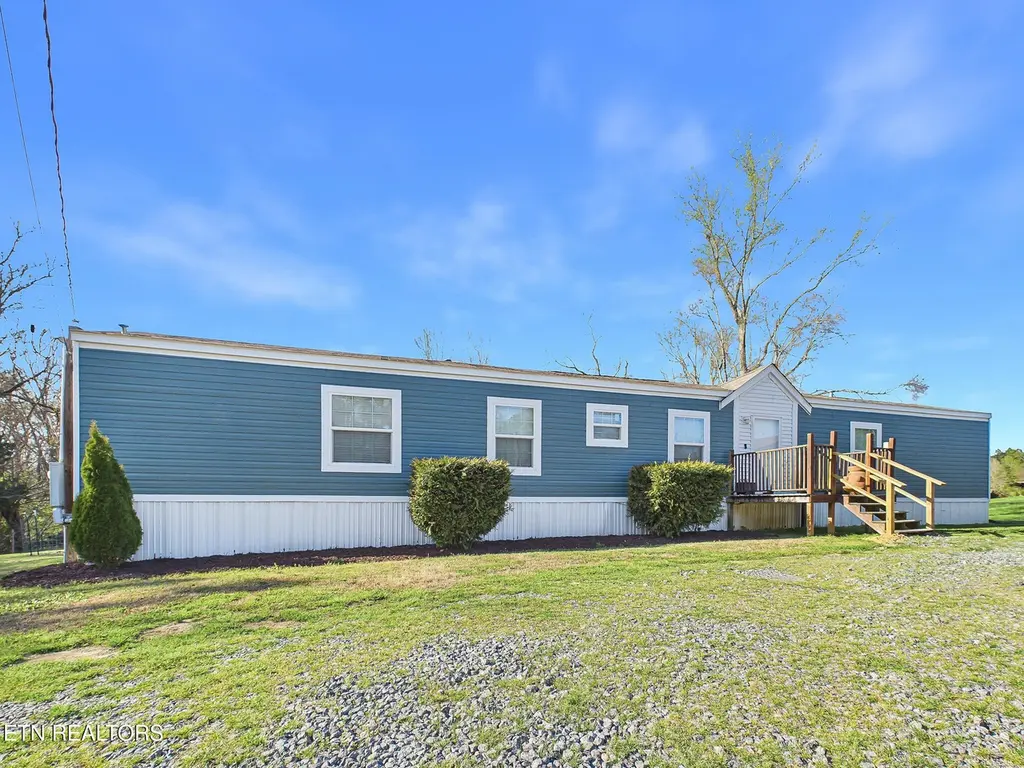
2073 Charles Rd
Sale Creek, TN 37322
$174,500D-
3 bd · 2.0 ba ·
1,216 sqft ·
Built 2015
· Manufactured
· Pending
· 5 DOM
Cashflow @ list (25.0% down · 7.5%)
Estimated rent
$1,278/mo
Mortgage (P&I)
−$915
Tax + insurance
−$291
HOA
−$0
Vac / Maint / Mgmt
−$268
Net cashflow
$-196/mo
Annual
$-2,352/yr
Cap rate
4.95%
Cash-on-cash
-4.81%
DSCR
0.79
1% rule
0.73%
Cash to close
$48,860
Investor read
- This is a 3-bed/2.0-bath manufactured listed at $174k.
- At list price, monthly cash flow is $-196 ($-2k/yr) — negative.
- To cash-flow at today's rent, offer at most $146k (16.3% below list).
- To meet the 1% rule (rent ≥ 1% of price), the offer needs to be $128k (26.7% below list).
- Only 5 days on market — expect competitive offers; lowballing is unlikely to land.
- Recommended offer: $128k (26.7% below list) — sets the bar for 1% rule.
- In year one you build about $19k of equity ($1k loan paydown + $17k appreciation (10.0% local appreciation)).
- Location reads 62/100 on livability (#211 in TN) — a middle-class / working-renter tenant base. Strengths: cost of living A+, housing A+, crime A; Watch: health & safety C-, employment D, amenities F.
- Meigs County (rural): math 16% / reading 22% proficiency, ranked #122 of 139 in TN (top 88%) — low school quality limits family demand, transient renter base, plan for 1-2y turnover.
- Zoned schools: Meigs Middle School (math 19% / reading 21%, grade F, #198 of 333 statewide, top 61%, 390 students, 0% FRL); Meigs County High School (math 12% / reading 22%, grade F, #225 of 332 statewide, top 69%, 538 students, 0% FRL) — zoned schools average 0% FRL vs 57% district-wide (57 pts lower); this property's tenant base skews higher-income than the district average.
- Market conditions: 240 active listings in the ZIP; 94 units permitted in Meigs County in 2024 (0 in 5+ unit buildings).
- Meigs County population projected to shrink 8% by 2050 — rents likely to lag national; underwrite the cash flow, not the appreciation.
- 2 sale attempts with the ask held roughly flat each time — persistent listings suggest the price (not the market) is what's stuck; bring a comps-based counter.
- By year 3, paydown + projected appreciation supports a ~$47k cash-out refi (75% LTV) — recoverable capital for the next deal without selling this one.
- Climate carrying-cost: major wildfire risk; extreme-heat days projected 7→20/yr by 2055 (HVAC capex compounding) — expect insurance premiums to compound above CPI over the hold.
- Cap rate 4.9% vs local median 2.2% in Sale Creek — top-decile yield for the area; either an underpriced asset or a hidden risk that comps aren't pricing in. Stress-test before assuming the spread holds.
Questions for listing agent
- What do current leases actually rent for vs. the listed asking? Can we see a recent rent roll and the last 12 months of T-12 income?
- Is there a deadline driving the sale (1031 exchange, divorce, estate, relocation)? That informs how much negotiation room exists.
- Schools are D-rated, which usually means shorter tenancies and higher turnover. Who's the typical renter profile here, and what's been the actual vacancy rate?
- The area grade is low — what's the realistic commute time and amenity access for the typical tenant pool here? Any planned neighborhood developments (good or bad) we should know about?
- What's the average days-on-market for RENTAL listings here right now (not sales)? A rising rental-DOM trend means longer vacancies and softer asking-rent achievability than the comps imply.
- What's the recent tenant-quality profile in this submarket — average credit score on applications, eviction rate, late-payment / NSF rate, and stable-employment percentage? A property-management company in the area should have these aggregated.
- How much new for-sale + rental construction is in the pipeline within 1–3 miles? Heavy new supply typically softens prices + rents 12–24 months out; constrained supply supports both.
CashFlowRE · CFR-JSC178678KMAMP
· Data 4 days ago
cashflowre.app · 2026-05-29