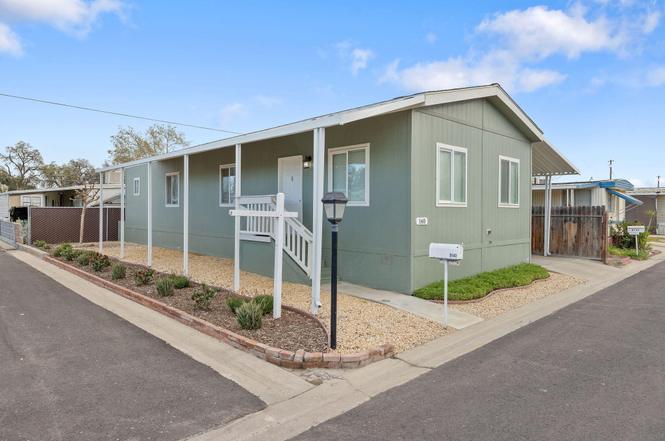
26814 S Mooney Blvd Unit D140
Visalia, CA 93277
$139,000B-
3 bd · 2.0 ba ·
1,097 sqft ·
Built 2022
· Land
· Active
· 133 DOM
Cashflow @ list (25.0% down · 7.5%)
Estimated rent
$1,908/mo
Mortgage (P&I)
−$729
Tax + insurance
−$232
HOA
−$0
Vac / Maint / Mgmt
−$401
Net cashflow
$547/mo
Annual
$6,563/yr
Cap rate
11.01%
Cash-on-cash
16.86%
DSCR
1.75
1% rule
1.37%
Cash to close
$38,920
Investor read
- This is a 3-bed/2.0-bath land listed at $139k.
- At list price, monthly cash flow is $547 ($7k/yr) — positive.
- The deal already cash-flows at list — no discount required.
- Meets the 1% rule at list price ($2k rent vs $139k).
- It's been on market 133 days — a 12% lower offer ($122k) is reasonable based on typical stale-listing flexibility.
- Recommended offer: $122k (12.0% below list) — sets the bar for market timing.
- Local home prices are declining (-3.0%/yr); year-one equity from $961 of loan paydown is wiped out by about $4k of value loss. Plan a longer hold.
- Location reads 72/100 on livability (#196 in CA) — a middle-class / working-renter tenant base. Strengths: commute A+, housing A+, employment B; Watch: amenities D, crime D-, cost of living F.
- Tulare Joint Union High (suburban): math 18% / reading 52% proficiency, ranked #280 of 517 in CA (top 54%) — families likely to look elsewhere, expect single-tenant / working-renter base with shorter leases.
- Market conditions: Rents rising (+3.3%/yr); 233 active listings in the ZIP; 11 comparable units currently listed for rent nearby; rentals lingering (median 44d on market — plan ~5-8 weeks vacancy on turnover, expect pricing pressure); 73% of comp listings sitting > 30 days — soft ceiling on asking rent; solid renter incomes; 1,447 units permitted in Tulare County in 2024 (307 in 5+ unit buildings).
- Tulare County population projected at +10% by 2050 — modest demand growth; plan on rents tracking national, not racing it.
- 3 sale attempts with the ask held roughly flat each time — persistent listings suggest the price (not the market) is what's stuck; bring a comps-based counter.
- At projected returns (-3.0% appreciation + 3.3% rent growth), your $39k cash investment doubles in ~7 years — after that, you're playing with house money.
- Cap rate 11.0% vs local median 3.3% in Visalia — top-decile yield for the area; either an underpriced asset or a hidden risk that comps aren't pricing in. Stress-test before assuming the spread holds.
Questions for listing agent
- It's been on market 133 days. Have you received any prior offers? Is the seller open to a 12% concession, seller financing, or rate buy-down credit?
- Why hasn't it sold? Are there any deal-killer items the seller is aware of (foundation, flood, title, zoning, code violations)?
- Is there a deadline driving the sale (1031 exchange, divorce, estate, relocation)? That informs how much negotiation room exists.
- Crime grade is D in this area — have there been break-ins, vandalism, or insurance claims at this property in the last 3 years? What carrier currently insures it and at what premium?
- What's the average days-on-market for RENTAL listings here right now (not sales)? A rising rental-DOM trend means longer vacancies and softer asking-rent achievability than the comps imply.
- What's the recent tenant-quality profile in this submarket — average credit score on applications, eviction rate, late-payment / NSF rate, and stable-employment percentage? A property-management company in the area should have these aggregated.
- How much new for-sale + rental construction is in the pipeline within 1–3 miles? Heavy new supply typically softens prices + rents 12–24 months out; constrained supply supports both.
CashFlowRE · CFR-JSV0MT8GEGMC82
· Data 2 days ago
cashflowre.app · 2026-05-29