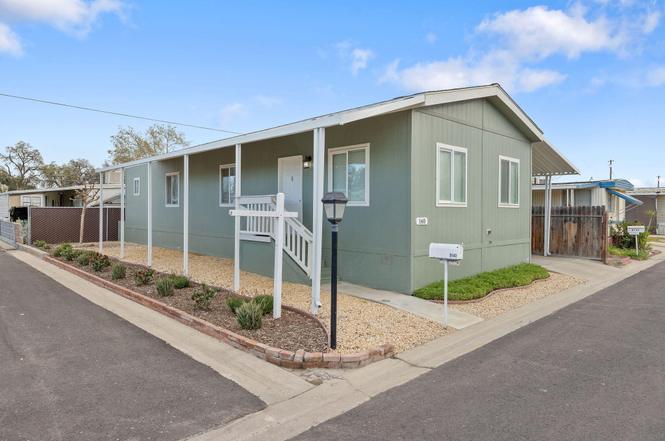
26814 S Mooney Blvd Unit D140 · Visalia, CA
Flood risk No data
- FEMA flood zone
- —
- Chance of flooding over 30 yrs
- —
- Est. flood insurance / yr
- —
Fire risk No data
- Est. fire insurance / yr
- —
Heat risk No data
- Hot days now (above threshold)
- —
- Hot days in 30 yrs
- —
Wind risk No data
- Chance of severe wind over 30 yrs
- —
Air-quality risk No data
- Unhealthy air days now
- —
- Unhealthy air days in 30 yrs
- —
Risk factors via First Street. Map © Google.
Why this score? — see what drove the B- grade
The composite is a weighted blend of 9 inputs, each scored 0–100. Each bar is that input's sub-score; the figure is the points it added to the 100-point composite (weight × sub-score).
- Cash flow +30.0/30.0
- DSCR +10.0/10.0
- 1% rule +8.7/10.0
- ARV discount +7.5/15.0
- Livability +3.6/5.0
- Rent growth +3.3/5.0
- Schools +3.0/10.0
- Condition / age +2.5/5.0
- Appreciation +0.0/10.0
$139,000
🖨 Deal sheet 📄 Offer letter ✓ Due diligence
Listing remarks
All freshened up and move-in ready with new paint throughout! Space D140 is a spacious 3-bedroom, 2-bath mobile home is ideally situated on a desirable corner space and features a cozy entrance= Room to build an extended front deck! Located in the family-friendly Rancho Robles community, residents enjoy an impressive array of amenities, including a sparkling swimming pool, a 1,900-square-foot clubhouse with an assembly hall, kitchen, and fireplace, a large outdoor patio, community garden, and a convenient on-site laundry facility, ideal for events, gatherings, and everyday living. Rancho Robles residents are also fortunate to live alongside the 104-acre Mooney Grove Regional Park, offerin
Key facts
- 17.18 acre lot
- Parking
- Community pool
Property features AI
Finance
- Other: Lot approximately 17.18 acres (private property details); Directions: From Caldwell and Mooney. South on Mooney to Rancho Robles Mobile Home Park on east side of street.
- HOA & community: Located in a mobile home park; Pool: private (community & private listed)
Exterior
- Parking: Has carport (1 space); Attached carport; Driveway; Guest parking
- Security: Carbon monoxide detector(s); Smoke detector(s)
- Utilities: Public water; Public sewer; Electricity connected; Natural gas connected/available; Sewer connected
- Home design: Manufactured in park (Double wide manufactured home); Single-story; No common walls; Updated/remodeled condition
- Construction: Metal siding; Vertical siding; Pillar/post/pier foundation; Metal, rolled/hot mop and shingle roof; Model: Skyline - Amber Cove; Mobile home size approximately 19' x 56'
- Exterior features: Awning(s); Garden; Covered front porch/porch; Private road frontage; Asphalt road surface; Private maintained road
Interior
- Kitchen: Range; Dishwasher; Free-standing range; Gas range; Ice maker; Microwave; Oven; Refrigerator; Stainless steel appliances
- Flooring: Carpet; Wood; Other
- Bathrooms: 2 full bathrooms
- Heating & cooling: Central air; Ceiling fan(s); Natural gas heating
- Interior features: Recessed lighting; Stone counters; Updated/remodeled interior
- Laundry & utility: Common area laundry room
Neighborhood map
What this means for you Summary
Snapshot
- This is a 3-bed/2.0-bath land listed at $139k.
Deal economics
- At list price, monthly cash flow is $547 ($7k/yr) — positive.
- The deal already cash-flows at list — no discount required.
- Meets the 1% rule at list price ($2k rent vs $139k).
- Recommended offer: $122k (12.0% below list) — sets the bar for market timing.
- Cap rate 11.0% vs local median 3.3% in Visalia — top-decile yield for the area; either an underpriced asset or a hidden risk that comps aren't pricing in. Stress-test before assuming the spread holds.
Location & tenants
- Location reads 72/100 on livability (#196 in CA) — a middle-class / working-renter tenant base. Strengths: commute A+, housing A+, employment B; Watch: amenities D, crime D-, cost of living F.
- Tulare Joint Union High (suburban): math 18% / reading 52% proficiency, ranked #280 of 517 in CA (top 54%) — families likely to look elsewhere, expect single-tenant / working-renter base with shorter leases.
- Market conditions: Rents rising (+3.3%/yr); 233 active listings in the ZIP; 11 comparable units currently listed for rent nearby; rentals lingering (median 44d on market — plan ~5-8 weeks vacancy on turnover, expect pricing pressure); 73% of comp listings sitting > 30 days — soft ceiling on asking rent; solid renter incomes; 1,447 units permitted in Tulare County in 2024 (307 in 5+ unit buildings).
Forward outlook
- Local home prices are declining (-3.0%/yr); year-one equity from $961 of loan paydown is wiped out by about $4k of value loss. Plan a longer hold.
- Tulare County population projected at +10% by 2050 — modest demand growth; plan on rents tracking national, not racing it.
- At projected returns (-3.0% appreciation + 3.3% rent growth), your $39k cash investment doubles in ~7 years — after that, you're playing with house money.
Negotiation context
- It's been on market 133 days — a 12% lower offer ($122k) is reasonable based on typical stale-listing flexibility.
- 3 sale attempts with the ask held roughly flat each time — persistent listings suggest the price (not the market) is what's stuck; bring a comps-based counter.
Questions for the listing agent
- It's been on market 133 days. Have you received any prior offers? Is the seller open to a 12% concession, seller financing, or rate buy-down credit?
- Why hasn't it sold? Are there any deal-killer items the seller is aware of (foundation, flood, title, zoning, code violations)?
- Is there a deadline driving the sale (1031 exchange, divorce, estate, relocation)? That informs how much negotiation room exists.
- Crime grade is D in this area — have there been break-ins, vandalism, or insurance claims at this property in the last 3 years? What carrier currently insures it and at what premium?
- What's the average days-on-market for RENTAL listings here right now (not sales)? A rising rental-DOM trend means longer vacancies and softer asking-rent achievability than the comps imply.
- What's the recent tenant-quality profile in this submarket — average credit score on applications, eviction rate, late-payment / NSF rate, and stable-employment percentage? A property-management company in the area should have these aggregated.
- How much new for-sale + rental construction is in the pipeline within 1–3 miles? Heavy new supply typically softens prices + rents 12–24 months out; constrained supply supports both.
Investment metrics
- 1% rule
- 1.37% ✓
- Cap rate
- 11.01%
- Cash-on-cash
- 16.86%
- DSCR
- 1.75
- GRM
- 6.1
CMA / ARV
No comps found within radius.
Projected returns pro-forma
-3.0% appreciation · 3.32% rent growth · sell at horizon
- IRR
- 8.4%
- Equity multiple
- 1.33×
- Total profit
- $12,953
- Equity at exit
- $20,725
- IRR
- 18.0%
- Equity multiple
- 2.51×
- Total profit
- $58,794
- Equity at exit
- $12,018
Cash invested: $38,920 (down + closing). Projections, not guarantees.
Landlord ↔ Tenant lean methodology
- Overall (STATE)
- 18 Strongly Tenant-Friendly
- State California
- 18 Strongly Tenant-Friendly · D+13
- County
- — inherits STATE
- City
- — inherits STATE
ZIP-level market 93277
- Rents YoY
- 3.3%
- Active inventory
- 233
- Price-to-rent
- 6.1×
Monthly cashflow live
- Estimated rent
- $1,908 high interval (Pro) →
- Mortgage (P&I)
- −$729
- Tax est. 1.5%
- −$174 /mo · $2,085/yr
- Insurance
- −$58
- HOA
- −$0
- Vacancy / Maint / Mgmt
- −$401
- Net cashflow
- $547
Break-even live
UW: 25.0% down · 7.5% · 30yr · 1.5% tax · 5.0% vac · 8.0% maint · 8.0% mgmt
Financing live
Cash to close
- Down payment
- $34,750
- Closing costs
- $4,170
- Reserves months
- —
- Total cash needed
- —
Loan-product check · same deal, 3 products live
Conventional
25% down · 7.5% · 30yr
- Down + closing
- —
- Monthly P&I
- —
- Monthly cashflow
- —
- DSCR
- —
- Eligible?
- —
Personal DTI + credit; lowest rate.
DSCR
20% down · 8.5% · 30yr
- Down + closing
- —
- Monthly P&I
- —
- Monthly cashflow
- —
- DSCR
- —
- Eligible?
- —
No personal income docs; deal must DSCR.
Hard money
10% down · 12.0% · 12mo
- Down + closing
- —
- Monthly P&I
- —
- Monthly cashflow
- —
- DSCR
- —
- Eligible?
- —
Short-term bridge; refi at stabilization.
Rent comps 11 comps
| Address | Beds | Baths | Sqft | Rent | $/sqft | DOM | Units | Dist |
|---|---|---|---|---|---|---|---|---|
| 3940 S Shady Ct Apt 107 Visalia, CA | 2.0 | 2.0 | 950 | $1,695 | $1.78 | 43d | 1 | 0.65mi |
| 3940 S Shady Ct Unit 123 Visalia, CA | 2.0 | 1.0 | 910 | $1,695 | $1.86 | 43d | 1 | 0.65mi |
| 3940 S Shady Ct Apt 223 Visalia, CA | 2.0 | 2.0 | 910 | $1,950 | $2.14 | 43d | 1 | 0.65mi |
| 2546 W Victor Ct Unit 102 Visalia, CA | 3.0 | 2.0 | 1200 | $1,995 | $1.66 | 43d | 1 | 1.15mi |
| 2401 W Sunnyside Ave Unit 2403 Visalia, CA | 2.0 | 2.0 | 768 | $1,600 | $2.08 | 43d | 1 | 1.21mi |
| 3837 W Rialto Ave Visalia, CA | 3.0 | 2.0 | 1475 | $2,100 | $1.42 | 43d | 1 | 1.27mi |
| 324 W Kimball Ave Visalia, CA | 3.0 | 2.0 | 1297 | $2,500 | $1.93 | 13d | 1 | 1.28mi |
| 3909 W Nellis Ave Visalia, CA | 3.0 | 2.0 | 1475 | $2,100 | $1.42 | 21d | 1 | 1.29mi |
| 3922 W Nellis Ave Visalia, CA | 3.0 | 2.0 | 1475 | $2,500 | $1.69 | 43d | 1 | 1.29mi |
| 1917 W Whitendale Ave Unit 1917 Visalia, CA | 2.0 | 2.0 | 1048 | $1,295 | $1.24 | 43d | 1 | 1.31mi |
| 232 W Caldwell Ave Unit 19 Visalia, CA | 2.0 | 1.0 | 988 | $1,325 | $1.34 | 21d | 1 | 1.39mi |
Listing history 20 events
-
2026-06-18days on market $139,000 Active 133 DOM
-
2026-06-17days on market $139,000 Active 132 DOM
-
2026-06-16days on market $139,000 Active 131 DOM
-
2026-06-15days on market $139,000 Active 130 DOM
-
2026-06-14days on market $139,000 Active 128 DOM
-
2026-06-13days on market $139,000 Active 127 DOM
-
2026-06-10days on market $139,000 Active 125 DOM
-
2026-06-09days on market $139,000 Active 124 DOM
-
2026-06-08days on market $139,000 Active 123 DOM
-
2026-06-07days on market $139,000 Active 122 DOM
-
2026-06-03days on market $139,000 Active 118 DOM
-
2026-06-02days on market $139,000 Active 117 DOM
-
2026-06-01days on market $139,000 Active 116 DOM
-
2026-05-31days on market $139,000 Active 115 DOM
-
2026-05-30days on market $139,000 Active 114 DOM
-
2026-04-28status Active
-
2026-04-22status Pending
-
2026-01-30status Active
-
2026-01-30historical
-
2026-01-27$139,000 Active
ⓘ Source: listings_history table (triggers on properties + properties_extension) + one-shot
backfill from property_details.listing_events for pre-trigger history.
Nearby sold comps map
Loading sold comps map…
Walkable amenities ~0.75 mi
Loading nearby amenities…
Taxation est. · year 1
- Rental income
- $22,899
- − Mortgage interest
- −$7,786
- − Property taxes
- −$2,085
- − Insurance
- −$695
- − Repairs & maintenance
- −$1,832
- − Management
- −$1,832
- − Depreciation
- −$4,044
- Taxable income
- $4,625
- Est. tax owed @ 24.0%
- −$1,110
- After-tax cash flow
- $5,453/yr
For passive investors: Depreciation is non-cash, so a rental often shows a tax loss while cash-flowing — sheltering income. Rental losses are passive: they offset passive income freely, and up to $25,000/yr can offset ordinary (W-2) income if you actively participate and your MAGI is under $100k (phasing out to $0 by $150k); unused losses carry forward. On sale, claimed depreciation is recaptured at up to 25%, and gains may owe capital-gains tax (a 1031 exchange can defer both). Figures are a year-1 estimate at your 24.0% rate — not tax advice; consult a CPA.
Schools (NCES district)
- District
- Tulare Joint Union High
- NCES district ID
- 0639930
- Math proficiency
- 18% ▼ -6.00%
- Reading proficiency
- 52% ▼ -1.00%
- Median HH income
- $46,858
- Composite
- 29.91/100
- National rank
- #6384
- State rank
- #280 of 517 in CA
Livability — Visalia
- Score
- 72/100
- State rank
- #196
- US rank
- #6351
Category grades
Schools grade is shown separately in the Schools card above.
Census & demographics
- Census place
- Visalia, CA
- County
- Tulare County · 323,826 people
- City population
- 163,333
- Metro
- Visalia, CA
- Population (ZIP)
- 53,985
- Household income
- $80,548
- Rent vs Own
- Severe rent burden
- 1896.0
Population outlook (Tulare County) Hauer SSP2
- Today (2025)
- 484,681 people
- By 2030
- 496,241 · +2.4%
- By 2040
- 518,507 · +7.0%
- By 2050
- 534,920 · +10.4%
- By 2075
- 548,417 · +13.2%
- By 2100
- 513,085 · +5.9%
Race, ethnicity, and origin ACS 2023
- Neighborhood character
- Diverse neighborhood (Simpson 0.60)
- Race & ethnicity
- Hispanic / Latino 48% White 40% Two or more races 21% Asian 4% Black 2% Native American 2%
- Hispanic origin (detail)
- Mexican 44%
- Common ancestry
- Russian 3% Iranian 2% Italian 2%
- Foreign-born
- 12% · Canada, China
- Languages at home
- 73% English-only · Spanish 22% Chinese 2% Other Asian/Pacific 1%
Political lean MEDSL · Tulare
- 2024 margin
- Strong R (+20.7) · D 38.5% · R 59.2% · Other 2.3%
- 2008→2024 swing
- -5.4pp toward R · 2008: -15.3pp · 2024: -20.7pp
- All cycles
- 2024: R+20.7 2020: R+7.8 2016: R+12.1 2012: R+17.8 2008: R+15.3
Not yet ingested
- Civics
- —
Market trends
- HPI YoY
- ▼ -371.43%
- Current HPI
- 310.349
- Rent YoY
- ▲ 3.32%
- Metro
- Visalia, CA
- State GDP YoY
- ▲ 3.21%
- F500 in state
- 116
Industry mix (Fortune 500 HQ in CA)
| Industry | F500 HQs | Revenue |
|---|---|---|
| Technology | 27 | $1,492B |
|
||
| Financial Services | 3 | $174B |
|
||
| Retail | 3 | $44B |
|
||
| Insurance | 3 | $26B |
|
||
| Media / Entertainment | 2 | $115B |
|
||
| Pharmaceuticals / Biotech | 2 | $62B |
|
||
Price history
5 events — show timeline
- 2026-04-28 Relisted — TCMLS
- 2026-04-22 Pending — TCMLS
- 2026-01-30 Relisted — TCMLS
- 2026-01-30 Delisted — TCMLS
- 2026-01-27 Listed $139,000 TCMLS
Property tax history
-1.9%/yrLatest (2021): $204 · -1.8% YoY. Source: county tax records.
Cash-flow waterfall
monthlySold comps — $/sqft
last 12 mo · ≤1 miLoading sold comps…